Debugging
Debugging is very important in the process of custom page building. The Yida platform provides the following debugging methods during custom page building:
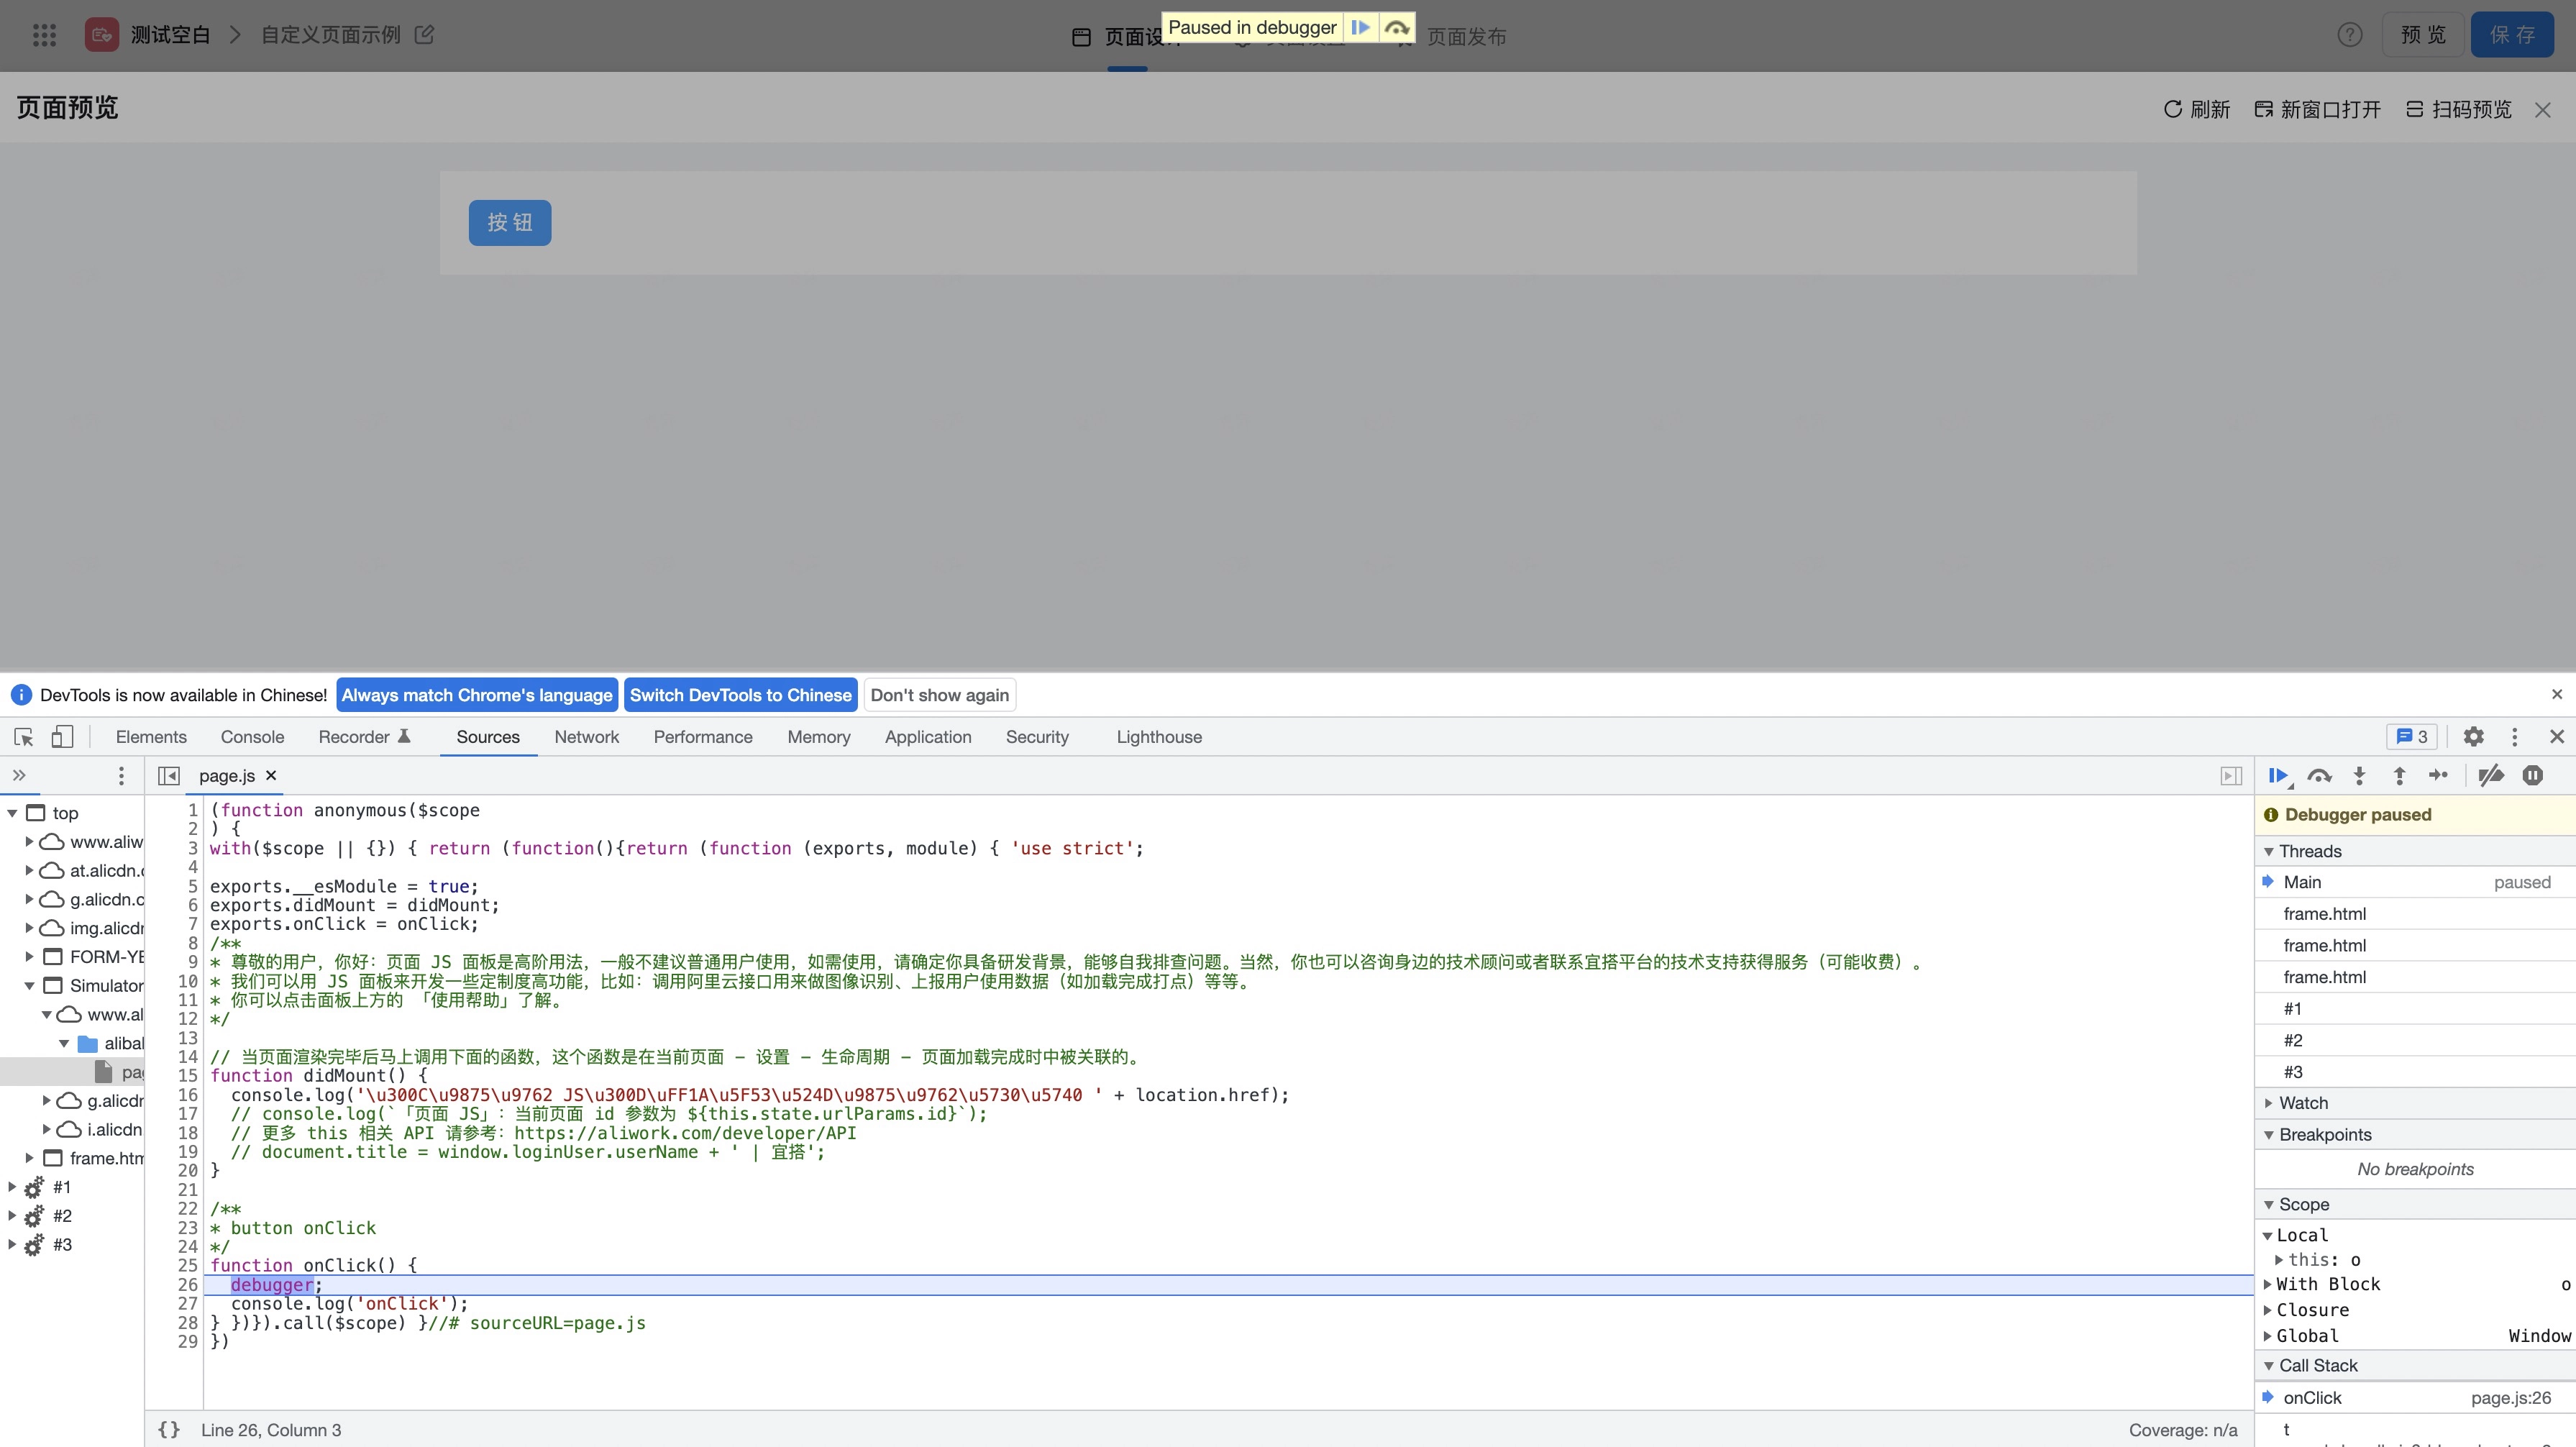
debugger
We can add debugger code in the action panel to set breakpoints, and during preview, trigger the breakpoints through user operations for single-line debugging:
-
Add debugger code:

-
Hit the breakpoint in the preview page and start single-point debugging:
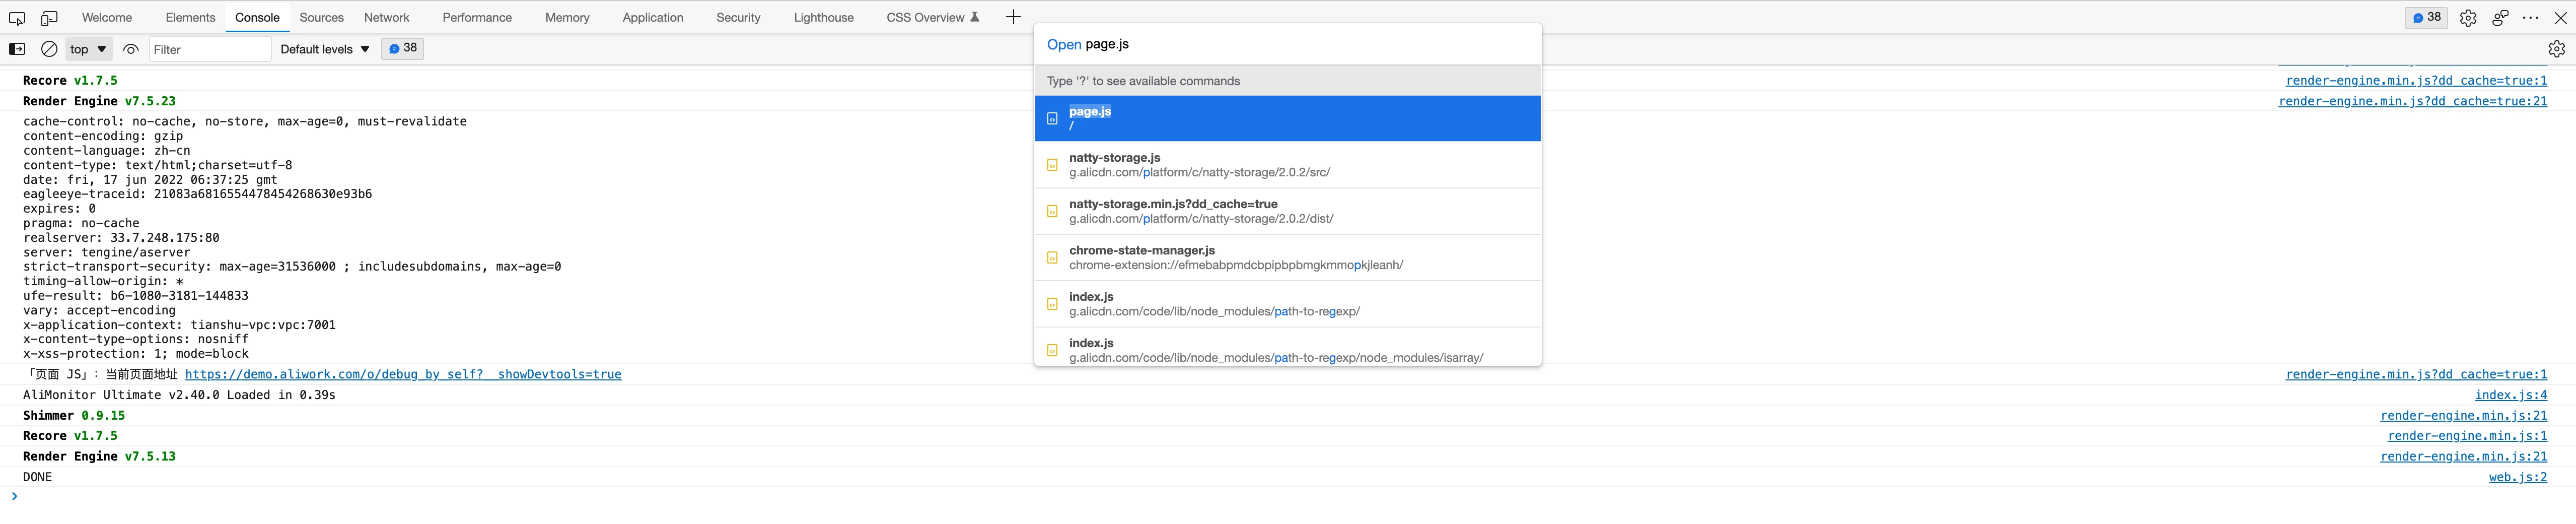
Open cmd/ctrl + p in browser console, enter page.js, and directly add breakpoint debugging

Open Self-service Debug Panel
Developers can also add a __showDevtools parameter to the page URL to enable the debug panel (Self-service Link), for example: https://www.aliwork.com/bench/feedback?__showDevtools.
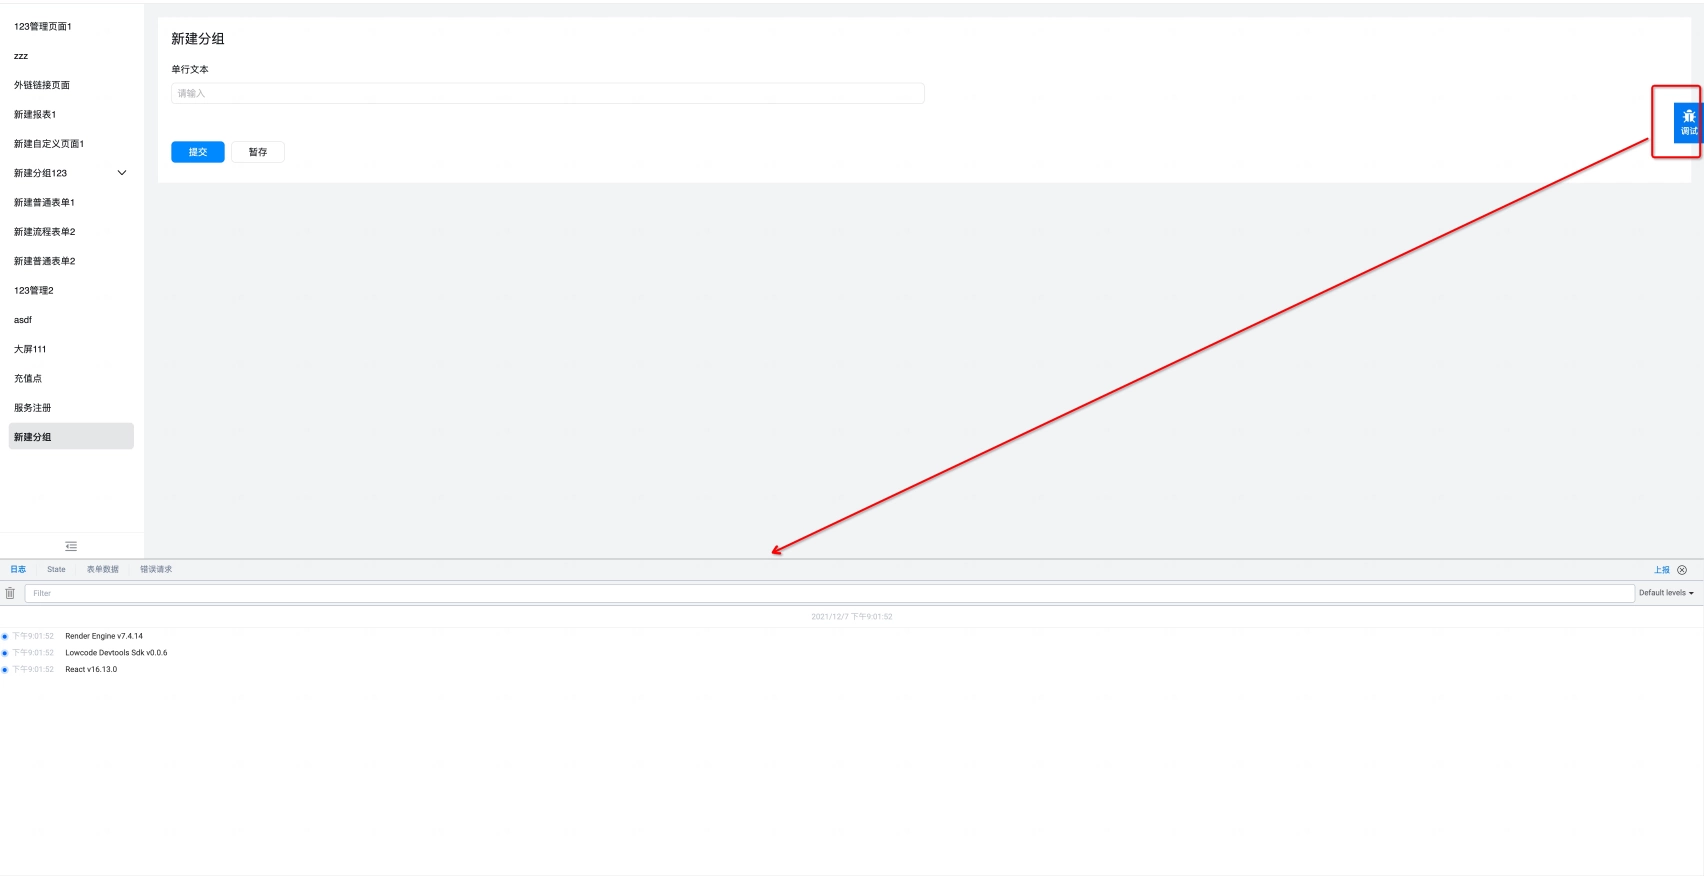
Through the debug panel, developers can perform the following operations:
- View data source variables;
- View form data;
- View error requests;
- Report error logs;
Most importantly, the debug panel makes mobile debugging very convenient.

Enable Schema Workbench (Schema Import/Export)
In the lower left corner of the Yida form designer, there is a button to enable the schema workbench entry. We can quickly generate pages by importing schemas in the schema workbench; it also supports users to edit schemas within the workbench, allowing quick definition of form definitions by modifying schemas. Users can directly append the __debug parameter to the URL of the design link to enable it (Self-service Link), as shown below:

Mobile/In-app Debugging via vConsole
Open the action panel of the page you need to debug, and directly enter the following code at the top. Access for debugging. Note that after debugging is completed, delete this code.
  const vConsole = 'https://g.alicdn.com/code/lib/vConsole/3.11.2/vconsole.min.js';
  const js = document.createElement('script');
  js.src = vConsole;
  document.body.append(js);
  js.onload = function() {
    window.vConsole = new window.VConsole();
  };

