Component Debugging
Introduction
Debugging within the Yida application refers to troubleshooting and resolving issues with custom components within the application, making component functionality better meet your business needs. Custom component debugging work is divided into simple debugging and application joint debugging modes.
Simple Debugging
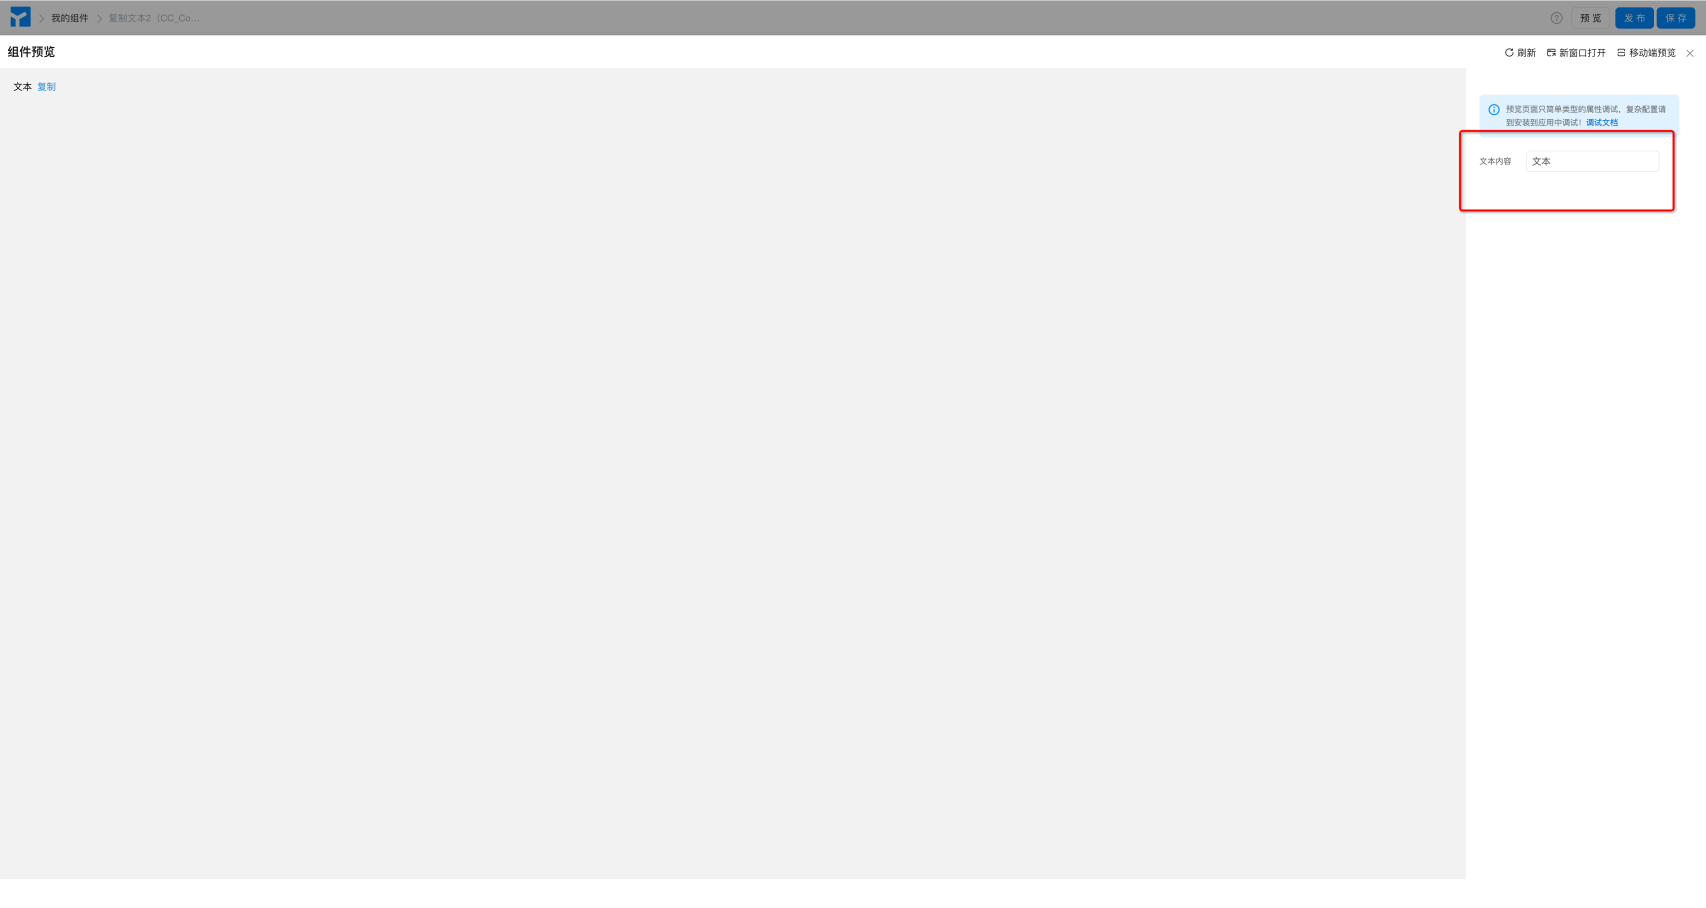
Clicking Preview in the low-code component designer allows testing of simple property configurations, such as text, boolean, and number. By changing the property values, you can see some effects.
Note: Please use Application Joint Debugging mode for the following scenarios:
- All properties and configurations related to
functioncannot be used in simple debugging mode; - Components related to organizations and applications, such as image upload, user search, etc., cannot be used in simple debugging mode;
Application Joint Debugging
Any debugging of configurations related to function during the custom component development and design process needs to be done through application joint debugging, including viewing return values, printing console.log() code in functions, etc.
Steps:
- Create a test application.
- Application Settings >> Component Management >> Find your developed component >> Click Install >> Select "0.1.0 (Development version, component changes can be synchronized in real-time)" >> Click Install. (As shown below)

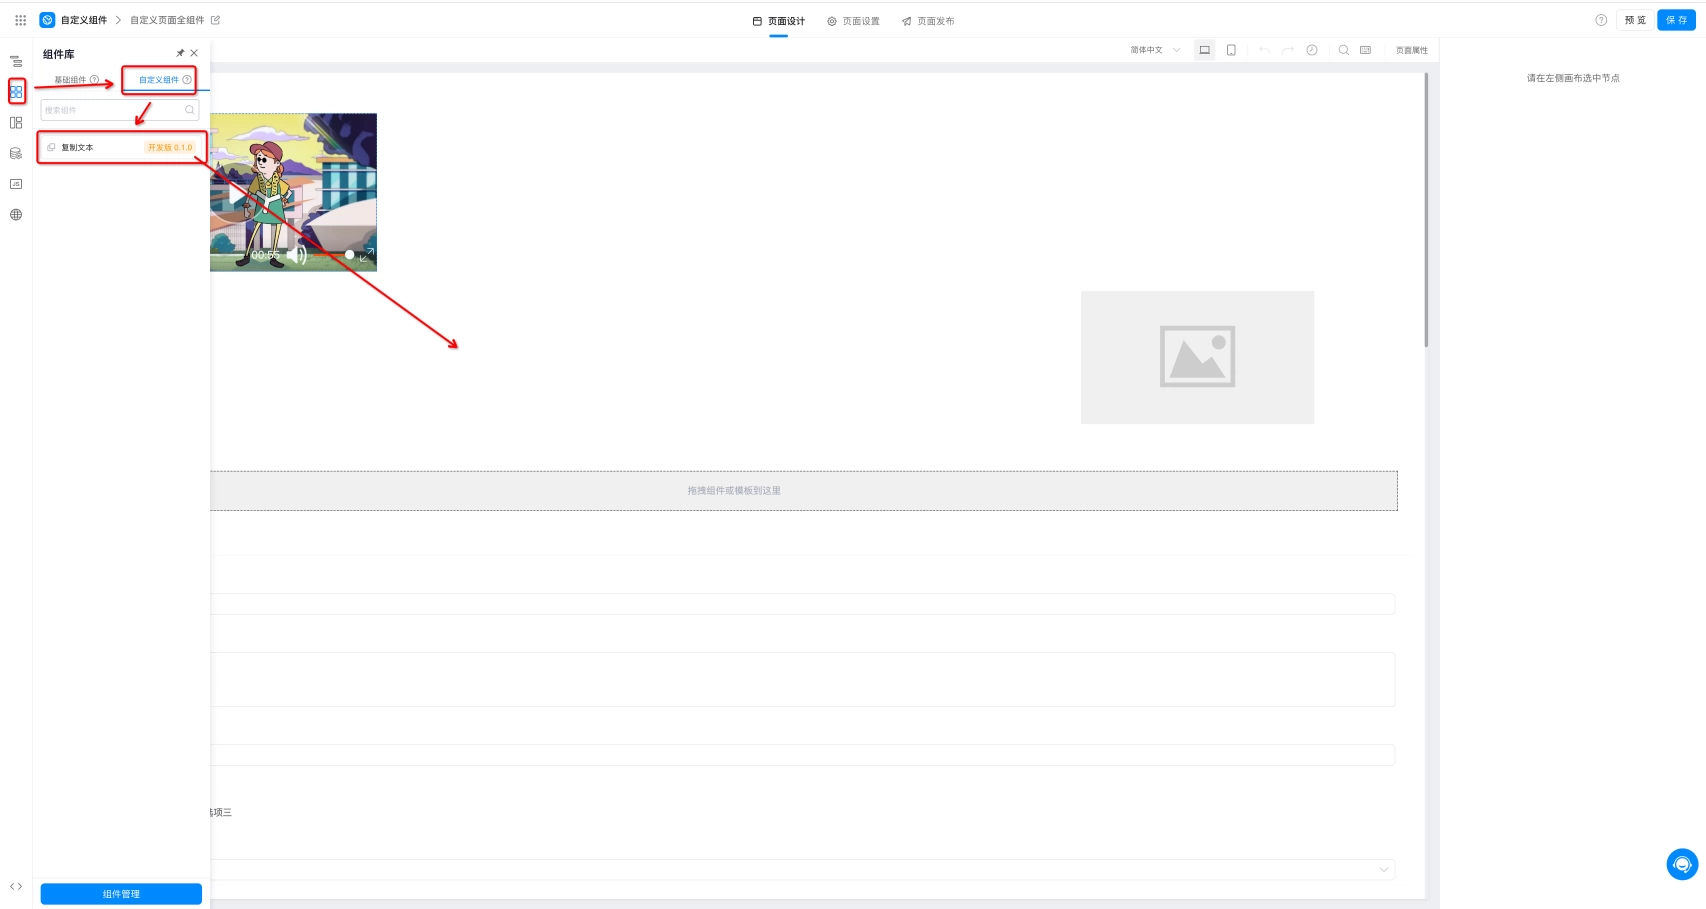
- After installation is complete, open the page designer, click the component panel, click Custom Components, and drag the component you just installed into the page designer. At this point, changes made in the component designer can be seen in real-time in the page designer. (As shown below)
- Do not debug components on production applications, to avoid affecting production applications.
- If you can't see your component in the custom component panel, please check if the installation scope is correct.