时间偏移
介绍
时间偏移是在聚合字段类型的基础上显示不同时间点数据的能力,一般用于做不同时期的数据对照显示。
说明:
设置了时间偏移的报表中,一次最多只能查询一万条数据。
配置面板
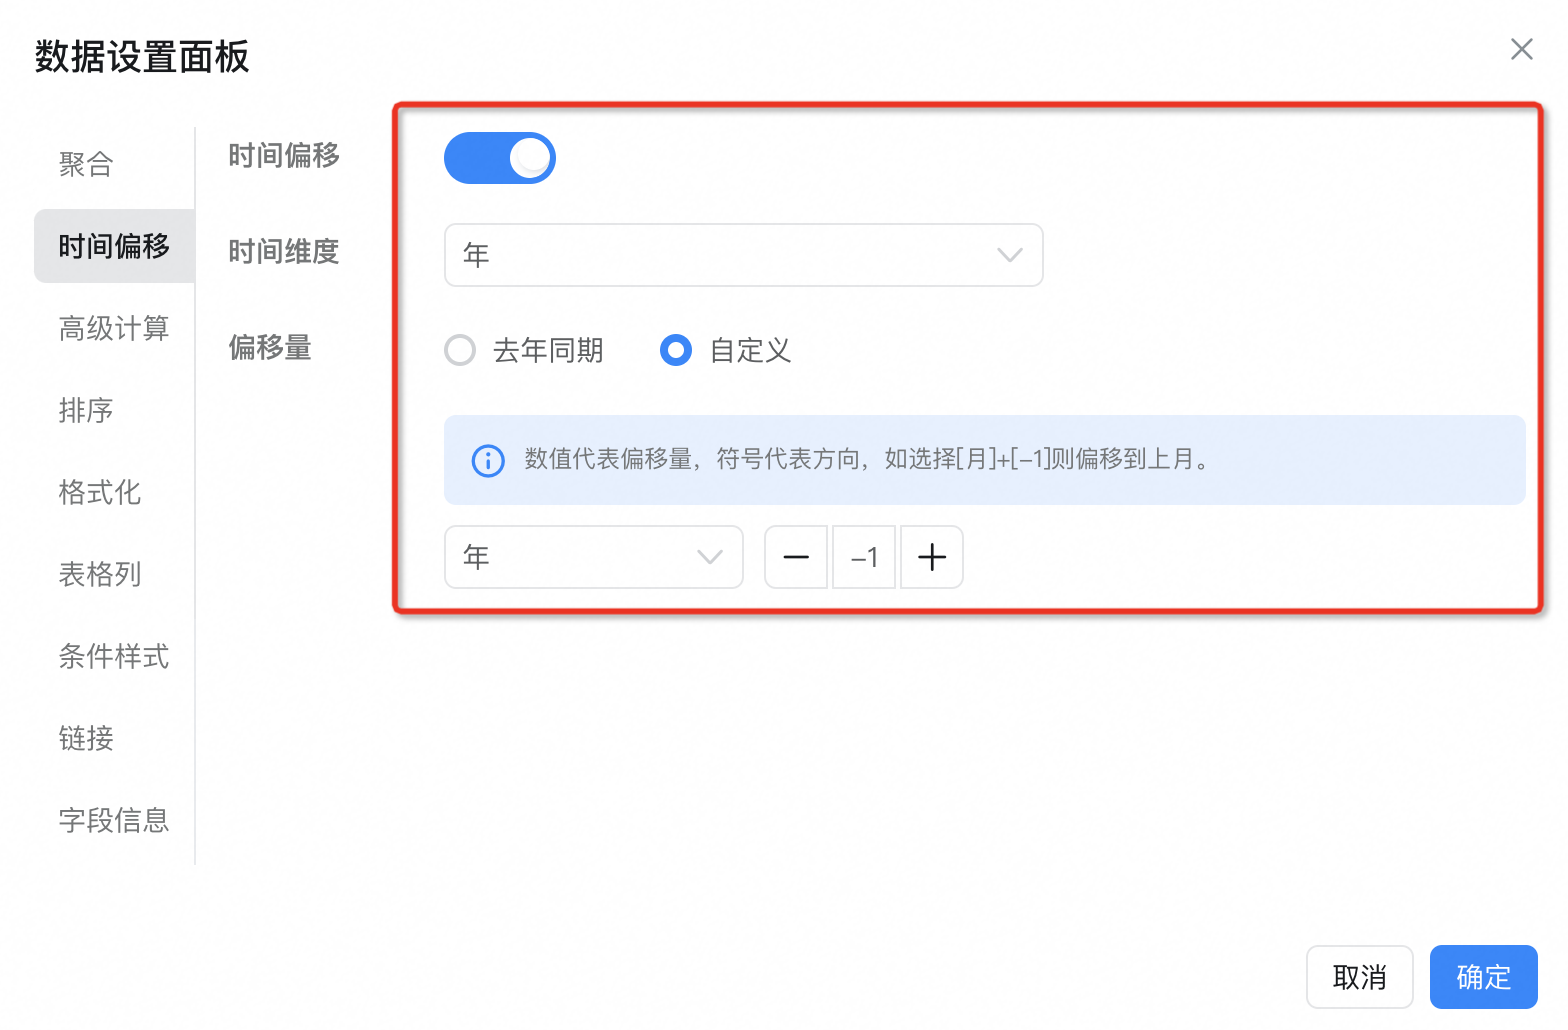
在数据设置面板的时间偏移选项卡下有如下配置:
时间偏移:是否开启时间偏移
时间维度:偏移的时间的粒度
偏移量:根据时间维度会有不同的偏移量,可以自定义配置偏移
具体配置
时间偏移的数据需要建立在时间基础上,在不同的组件上面,我们需要配置相应的时间字段。
柱状图
添加时间字段
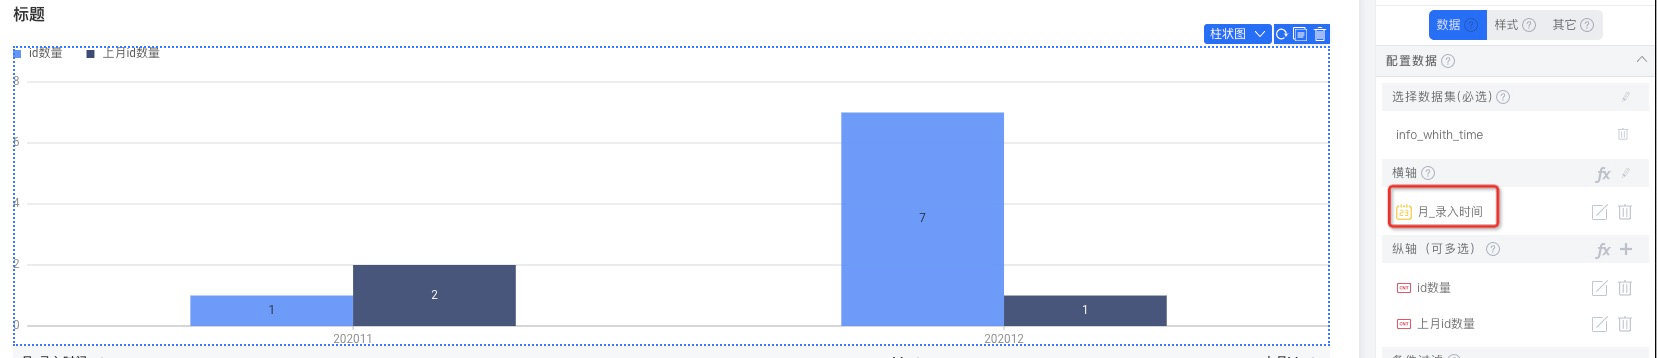
配置偏移字段
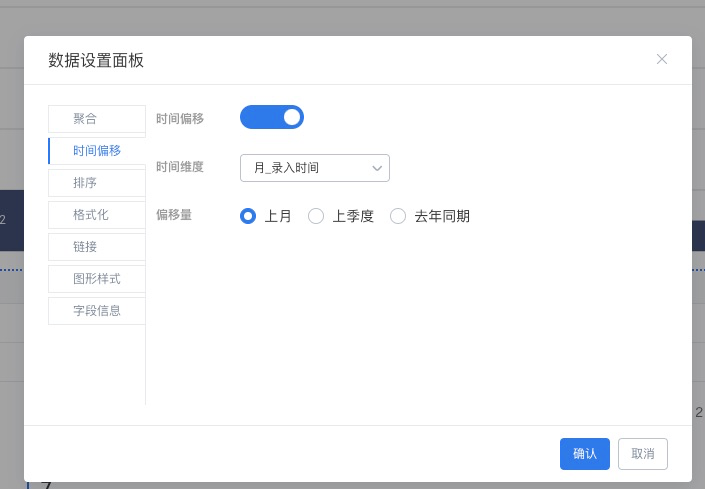
其中:id数量为原始字段,上月id数量为偏移到上个月的
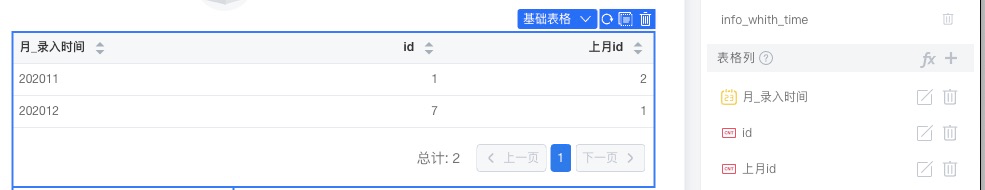
表格
表格与柱状图的配置过程类似
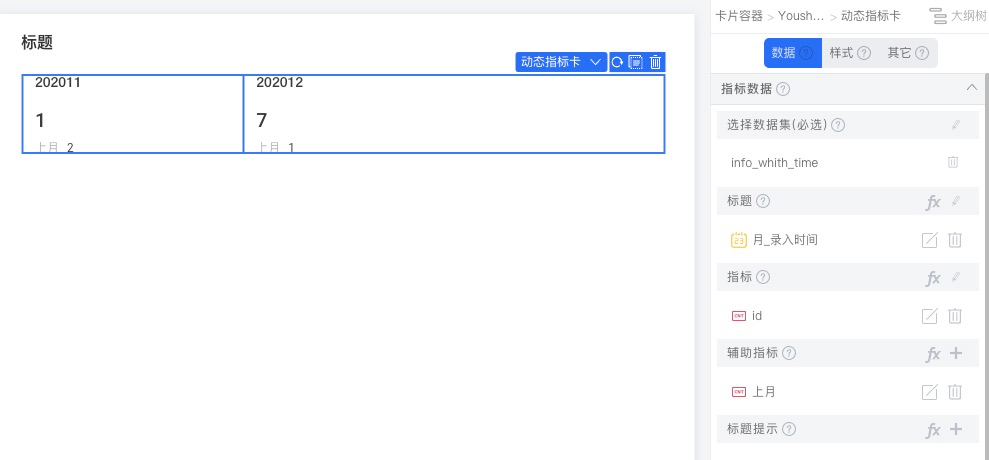
指标卡
在标题部分添加时间字段,然后可以辅助指标下添加带有时间偏移的参考数据。
指标卡更多配置介绍见:基础指标卡
此文档对您是否有帮助?