How to use Apache ECharts in custom pages?
Usage Scenario
In some cases, we want to use components that are not provided in the Yida component library in Yida's custom pages, such as ECharts chart components. Developers can introduce ECharts.js in custom pages to visualize Yida internal data, demonstrating how to introduce external JS in custom pages to realize complex scenario requirements.
Video Tutorial
Operation Steps
Step 1: Configure JSX component related properties
Create a custom page and drag a JSX component from the component library to the middle of the canvas, then set the id property and styles.
Operation method:
- Click to select the jsx component on the page, on the right property panel, click the "Edit JSX code" button;
- Add the id="main" field after div;
- Click on the style panel on the right, click "Source Code Editor", enter the
#main { height:400px }field;
As shown below:

Step 2: Bind didMount lifecycle to load remote JS resources
We can load js resources on the cdn in the page's didMount lifecycle (see documentation for details about custom page lifecycles). We can directly copy the following code to the didMount section in the custom page action panel, as shown below:
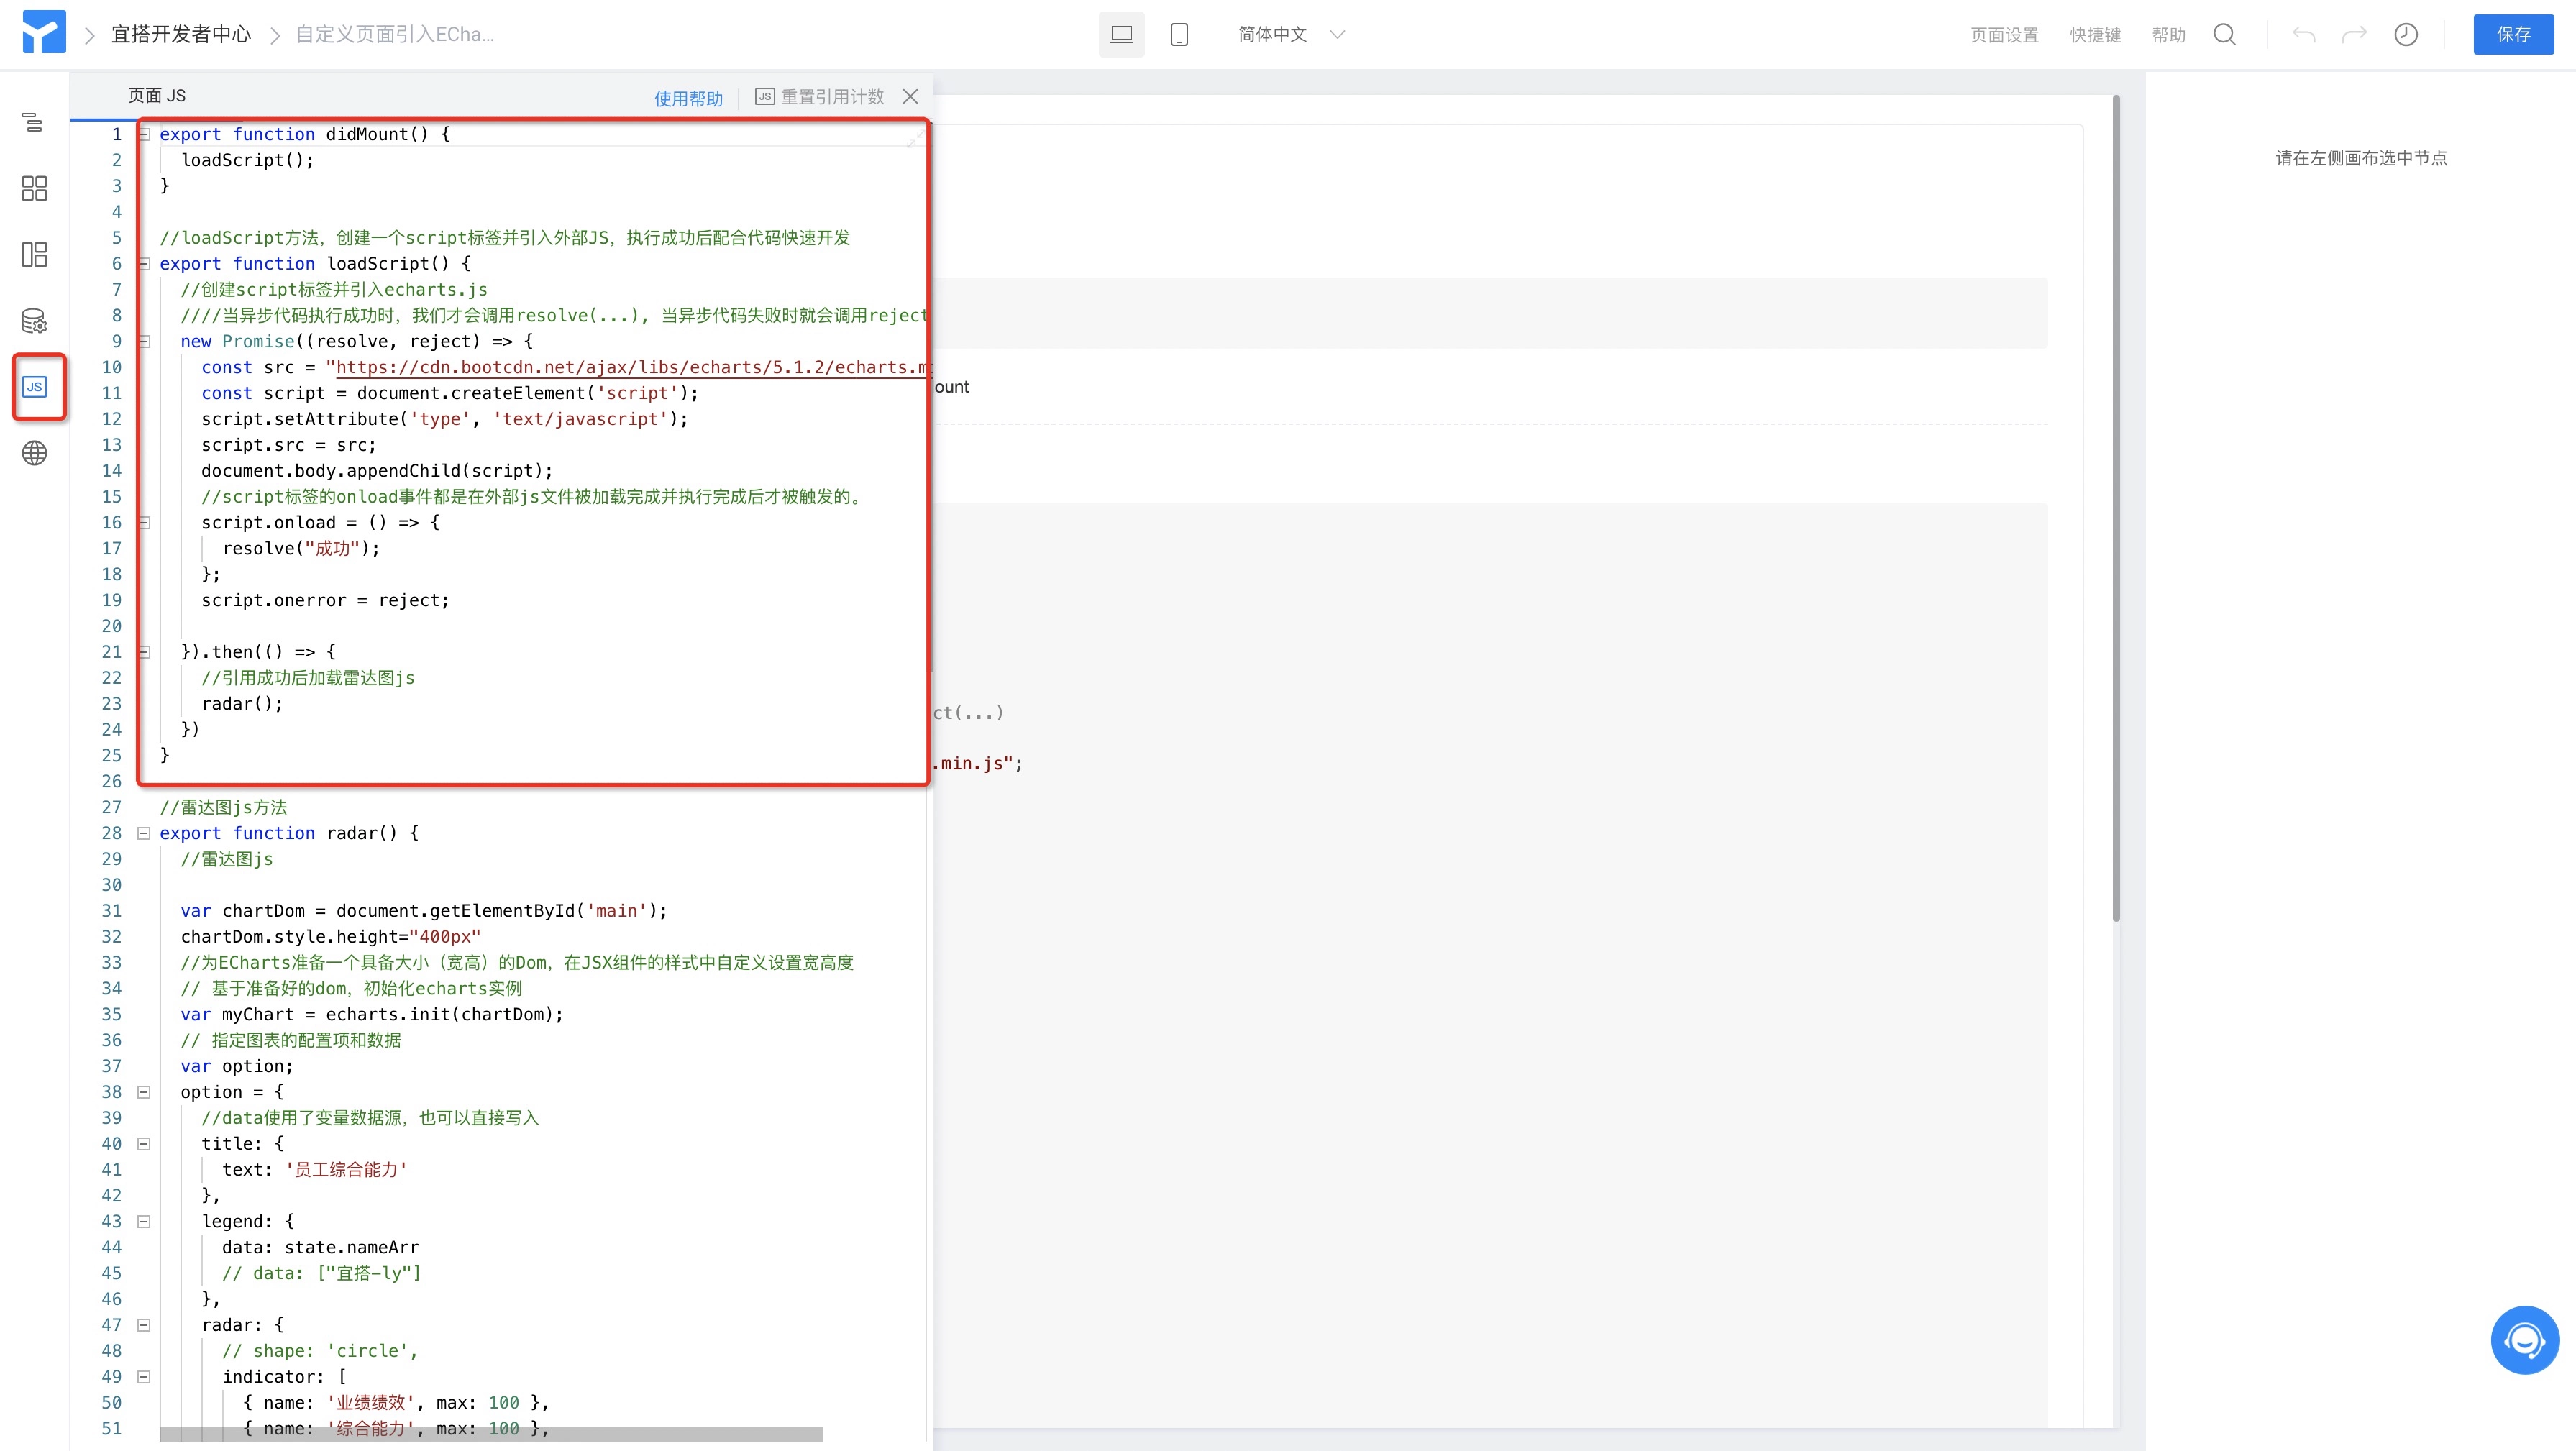
The code of the loadScript method is shown below:
//loadScript method, create a script tag and import external JS, execute resolve(...) when asynchronous code executes successfully, execute reject(...) when asynchronous code fails
export function loadScript() {
  //create script tag and import echarts.js
  ////When the asynchronous code executes successfully, we will call resolve(...), when the asynchronous code fails, reject(...) will be called
  new Promise((resolve, reject) => {
    const src = 'https://g.alicdn.com/code/lib/echarts/5.3.0/echarts.min.js';
    const script = document.createElement('script');
    script.setAttribute('type', 'text/javascript');
    script.src = src;
    document.body.appendChild(script);
    //The onload event of the script tag is triggered only after the external js file is loaded and executed completely.
    script.onload = () => {
      resolve('Success');
    };
    script.onerror = reject;
  }).then(() => {
    //Load radar chart js after reference succeeds
    radar();
  });
}
Step 3: Implement a radar chart rendering solution using ECharts
As can be seen from the above js implementation, after loading the remote JS resources, we execute a radar function to render the radar chart. We add a radar function in the action panel to render the radar chart to the jsx component we created in Step 1. For specific usage of radar charts, please refer to ECharts documentation;

The code of the radar method is shown below:
//Radar chart js method
export function radar() {
  //radar chart js

  var chartDom = document.getElementById('main');
  chartDom.style.height = '400px';
  //Prepare a Dom with size (width and height) for ECharts, customize width and height in the style of the JSX component
  // Initialize echarts instance based on the prepared dom
  var myChart = echarts.init(chartDom);
  // Specify the configuration and data for the chart
  var option;
  option = {
    //data uses variable data source, can also be directly written
    title: {
      text: 'Employee Comprehensive Ability',
    },
    legend: {
      data: state.nameArr,
      // data: ["Yida-ly"]
    },
    radar: {
      // shape: 'circle',
      indicator: [
        { name: 'Performance', max: 100 },
        { name: 'Comprehensive Ability', max: 100 },
        { name: 'Reactivity', max: 100 },
        { name: 'Professional Ability', max: 100 },
        { name: 'Judgment Ability', max: 100 },
        { name: 'Service Ability', max: 100 },
      ],
    },
    series: [
      {
        name: 'Employee Comprehensive Ability',
        type: 'radar',
        data: state.dataArr,
        // data: [
        //   {
        //     value: [80, 85, 90, 90, 88, 92],
        //     name: 'Yida-ly'
        //   }
        // ]
      },
    ],
  };
  // Use the just specified configuration and data to display the chart.
  option && myChart.setOption(option);
}
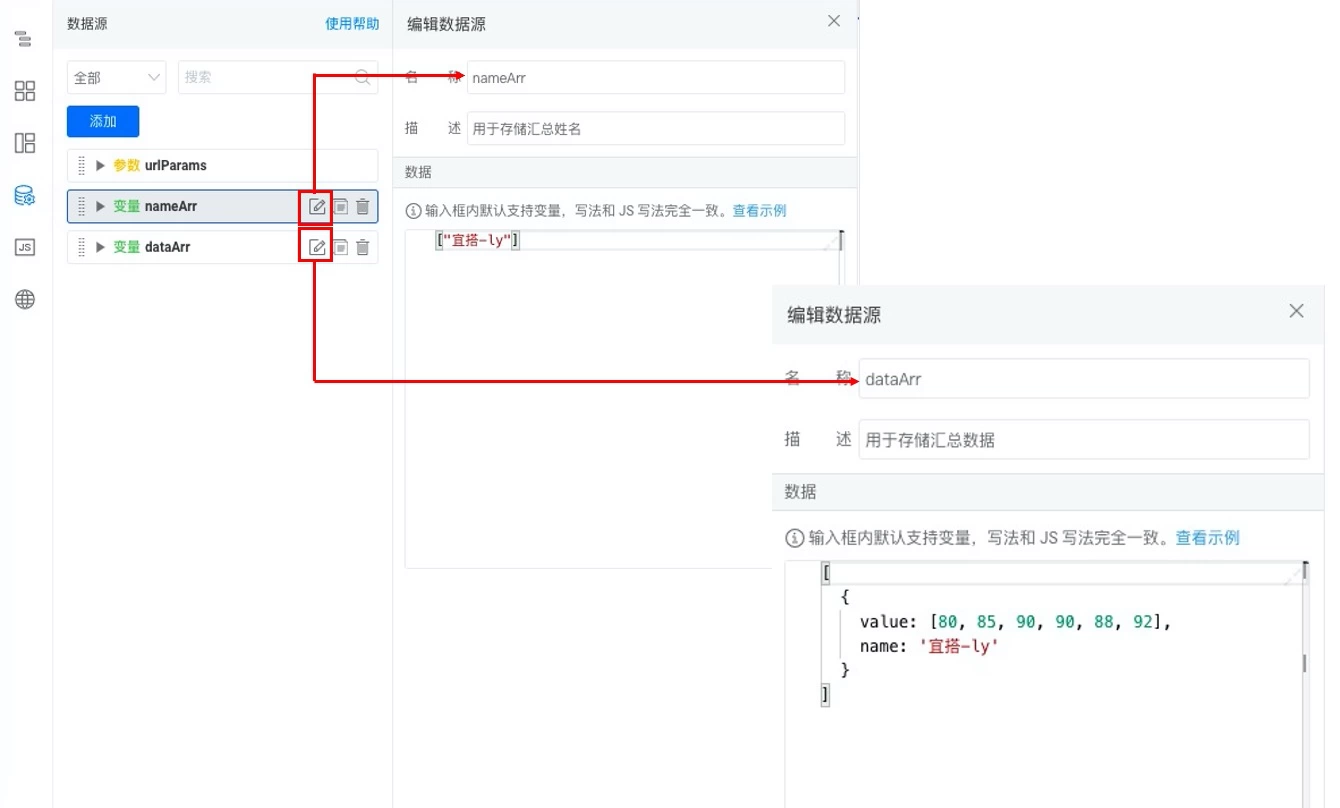
Step 3: Bind data variables
Through the above radar method, developers can see that we read two variables on the state: nameArr and dataArr. Therefore, we need to set the data variables for the radar chart, as shown below:
Display Effect
Users can access the official ECharts introduction example to view the result and specific implementation. The final display effect is as follows:
