Use JQuery Gantt chart for custom pages
This case comes from the three-party developer Li Rui 」
1. Usage scenarios
This example describes how to use JQuery Gantt chart to display progress data on the YIDA custom page.
2. Implement functions
2.1 create a data table
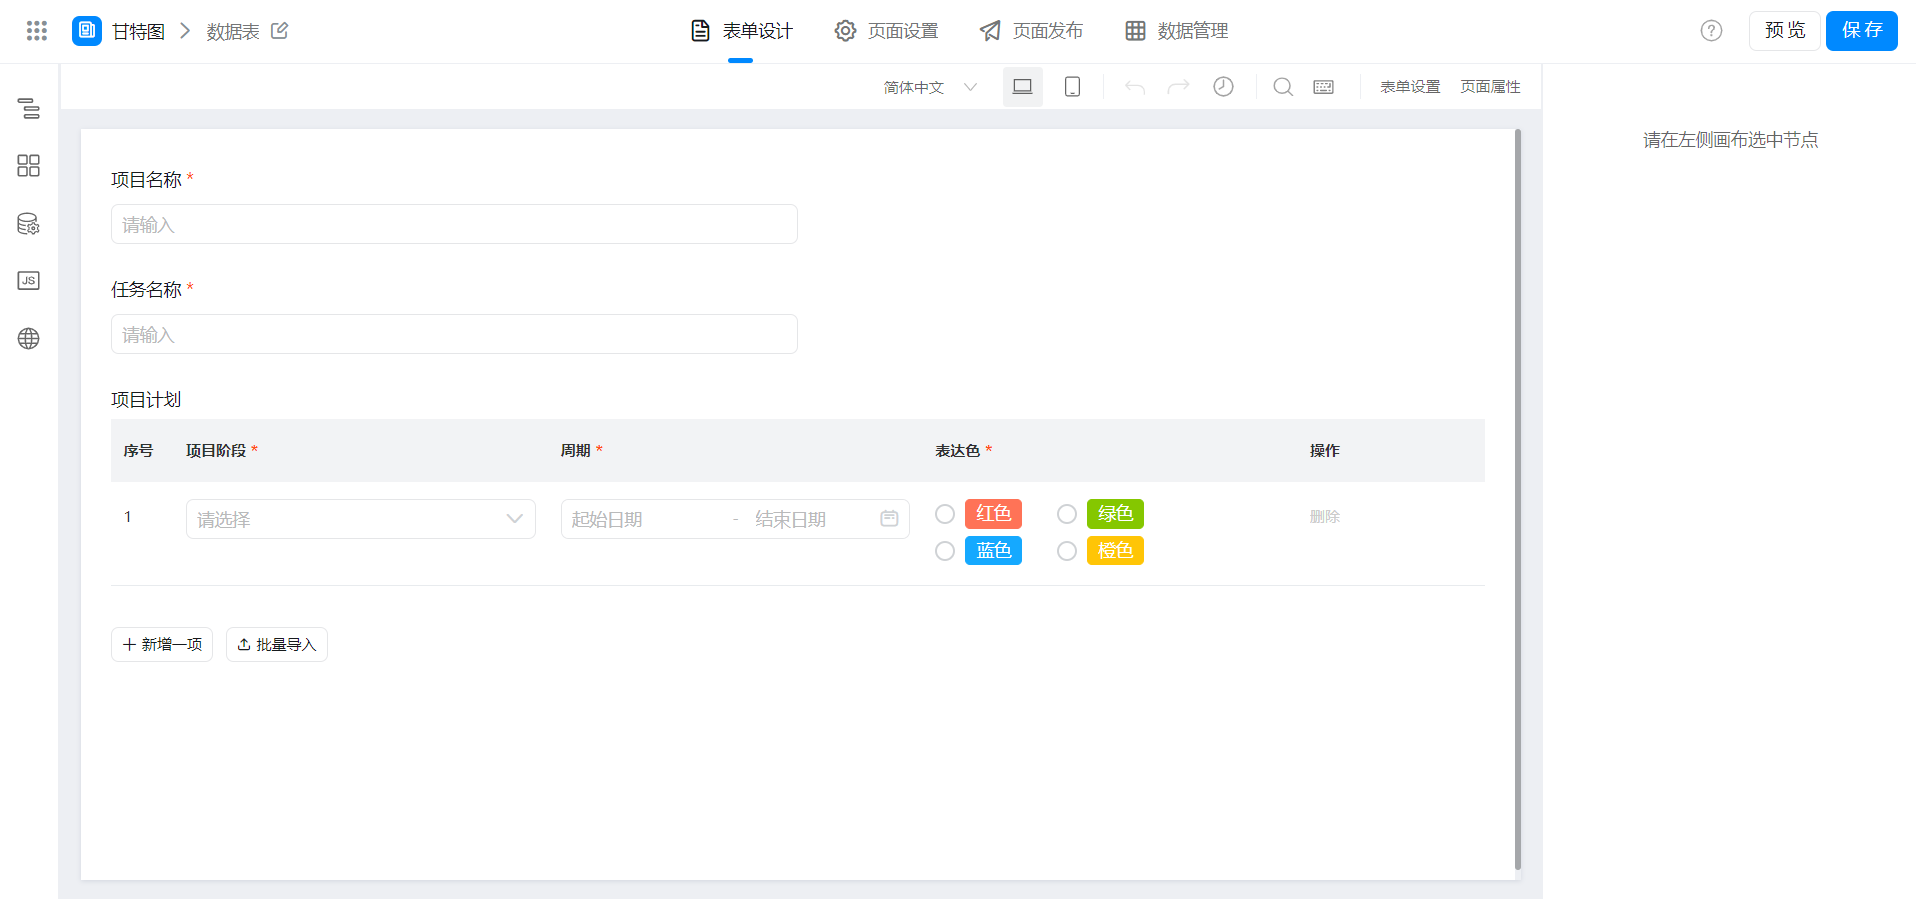
Express color drop-down options and option values:
红色 | ganttRed
绿色 | ganttGreen
蓝色 | ganttBlue
橙色 | ganttOrange
2.2 Create a custom page
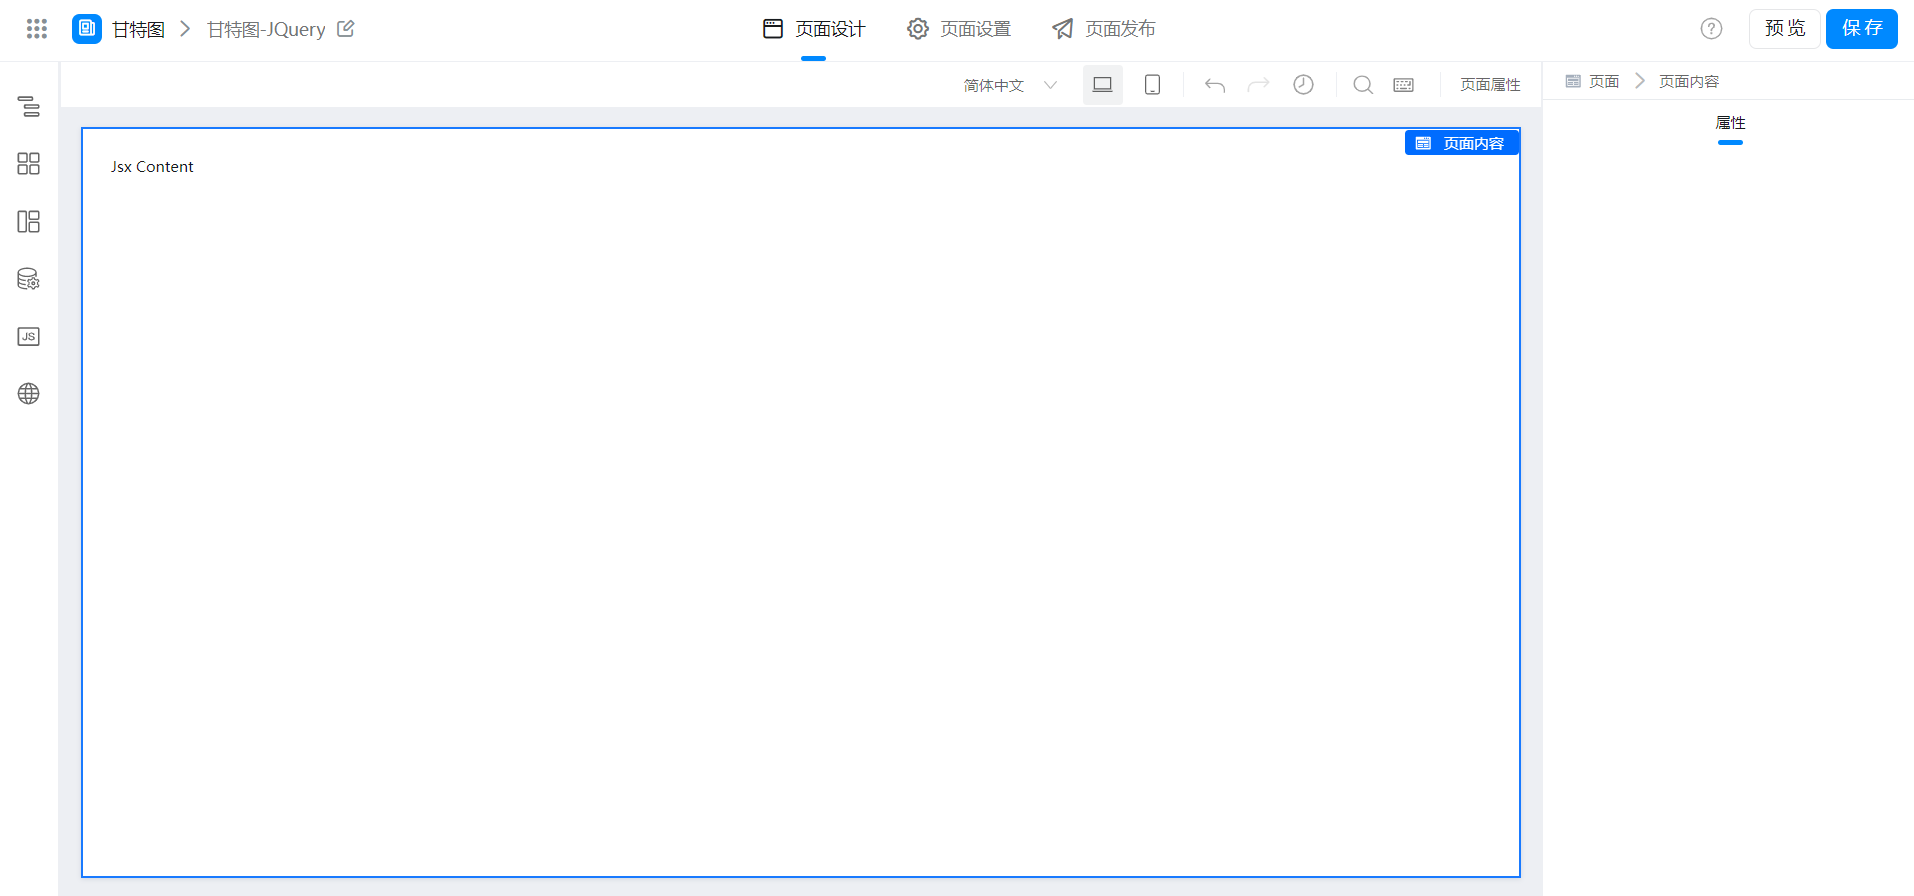
2.3 configure page functions
(1)JSX component configuration
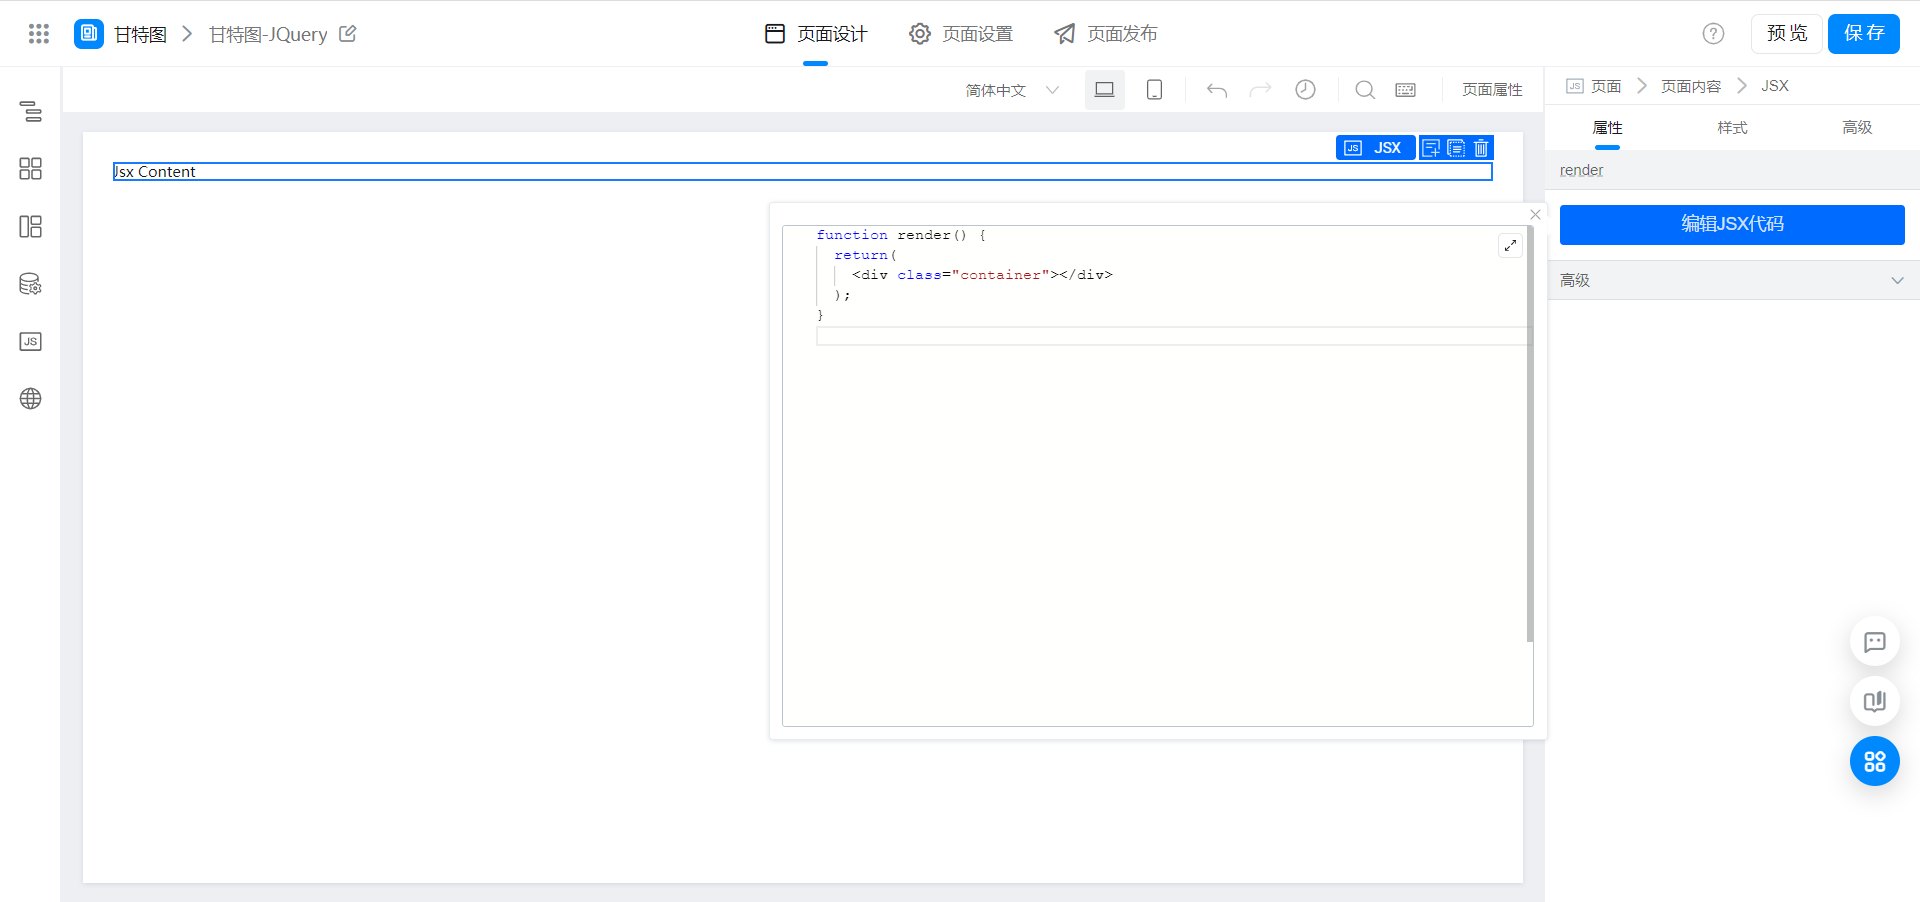
function render() {
  return(
    <div class="container"></div>
  );
}
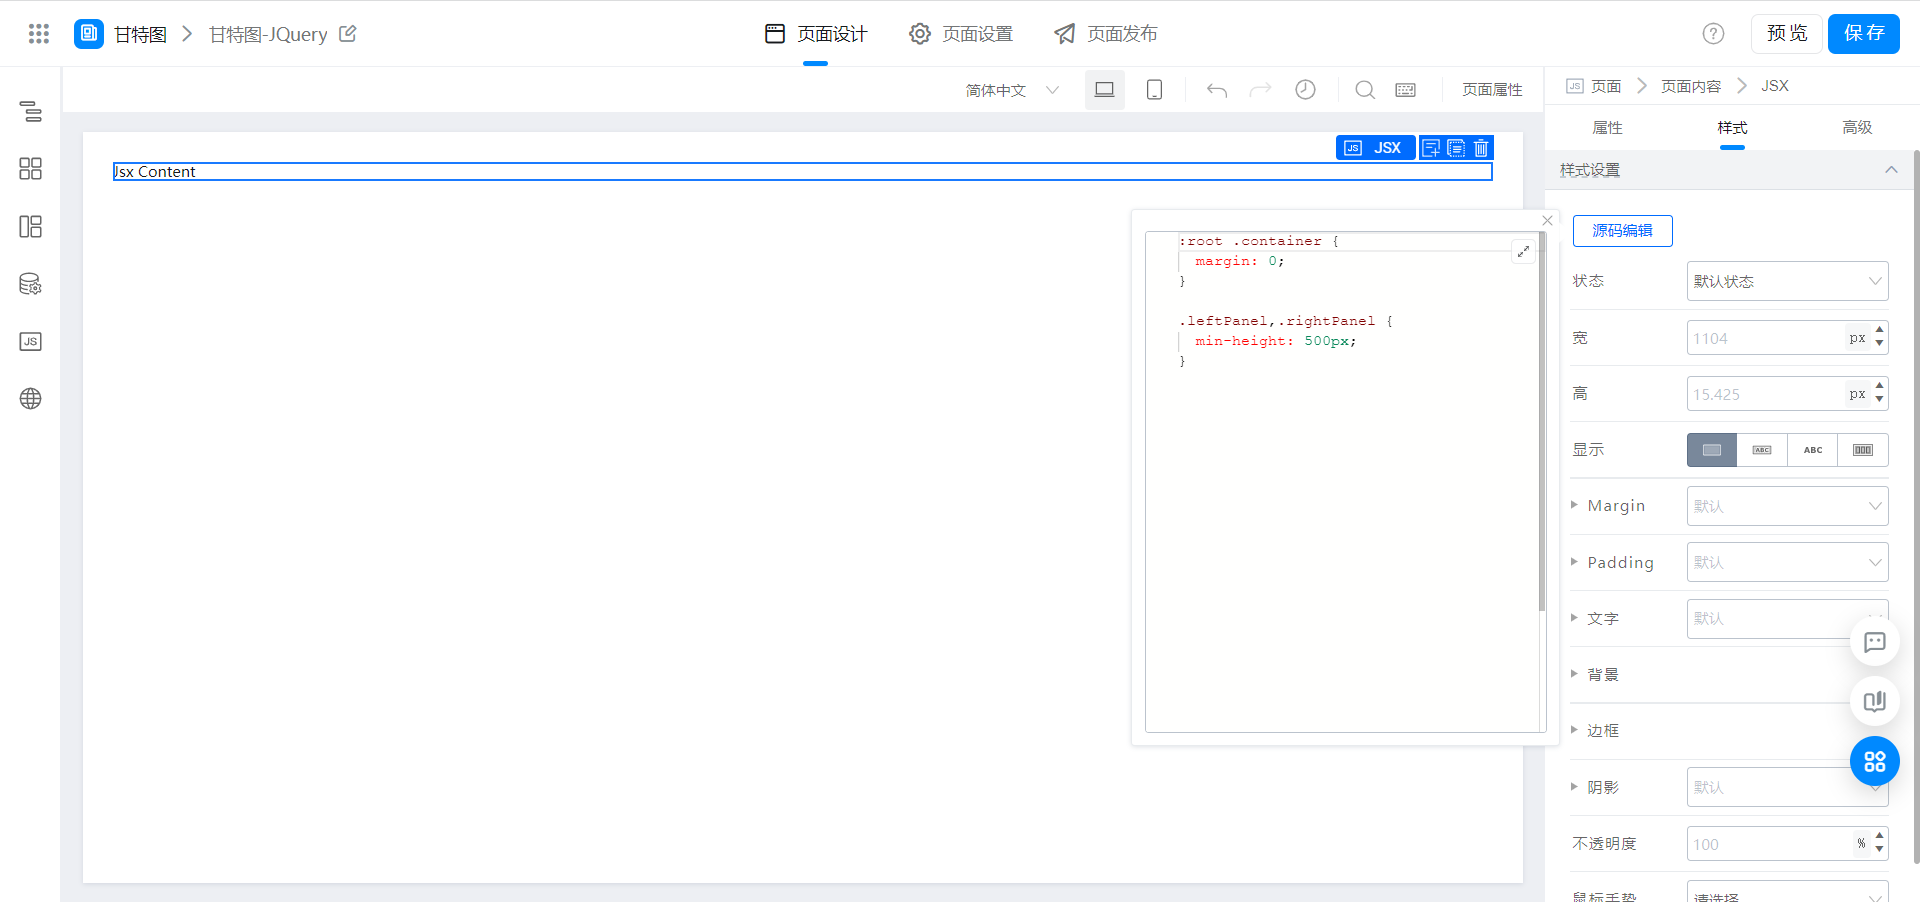
:root .container {
  margin: 0;
}

.leftPanel,.rightPanel {
  min-height: 500px;
}
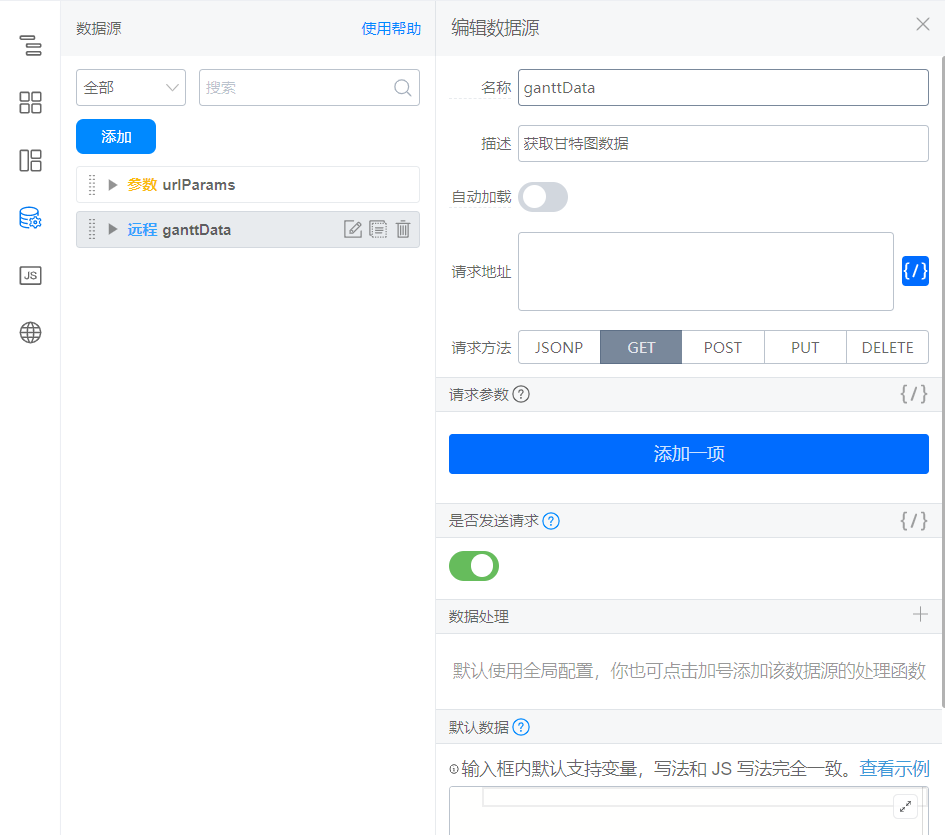
(2) configure data sources
(3) introduce Gantt chart tripartite resources
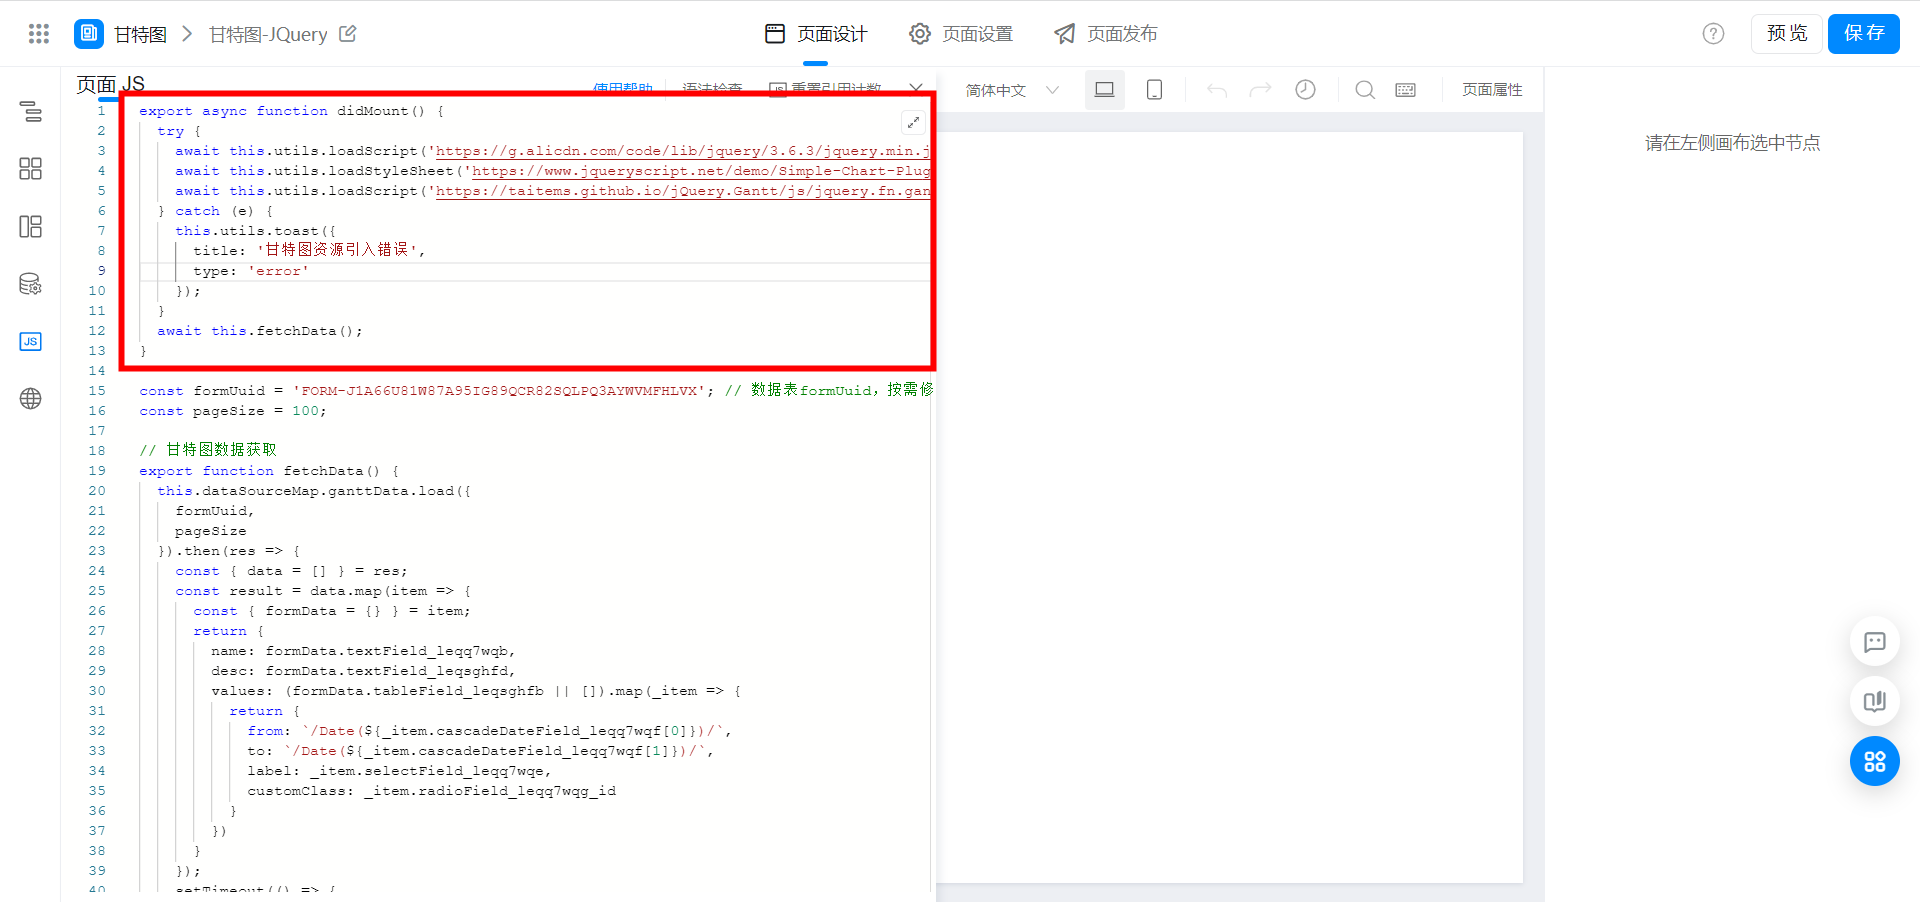
export async function didMount() {
  try {
    await this.utils.loadScript('https://g.alicdn.com/code/lib/jquery/3.6.3/jquery.min.js');
    await this.utils.loadStyleSheet('https://www.jqueryscript.net/demo/Simple-Chart-Plugin-with-jQuery-Gantt-Chart/css/style.css');
    await this.utils.loadScript('https://taitems.github.io/jQuery.Gantt/js/jquery.fn.gantt.js');
  } catch (e) {
    this.utils.toast({
      title: '甘特图资源引入错误',
      type: 'error'
    });
  };
  await this.fetchData();
}
(4) encapsulate Gantt chart data acquisition function and Gantt chart rendering function
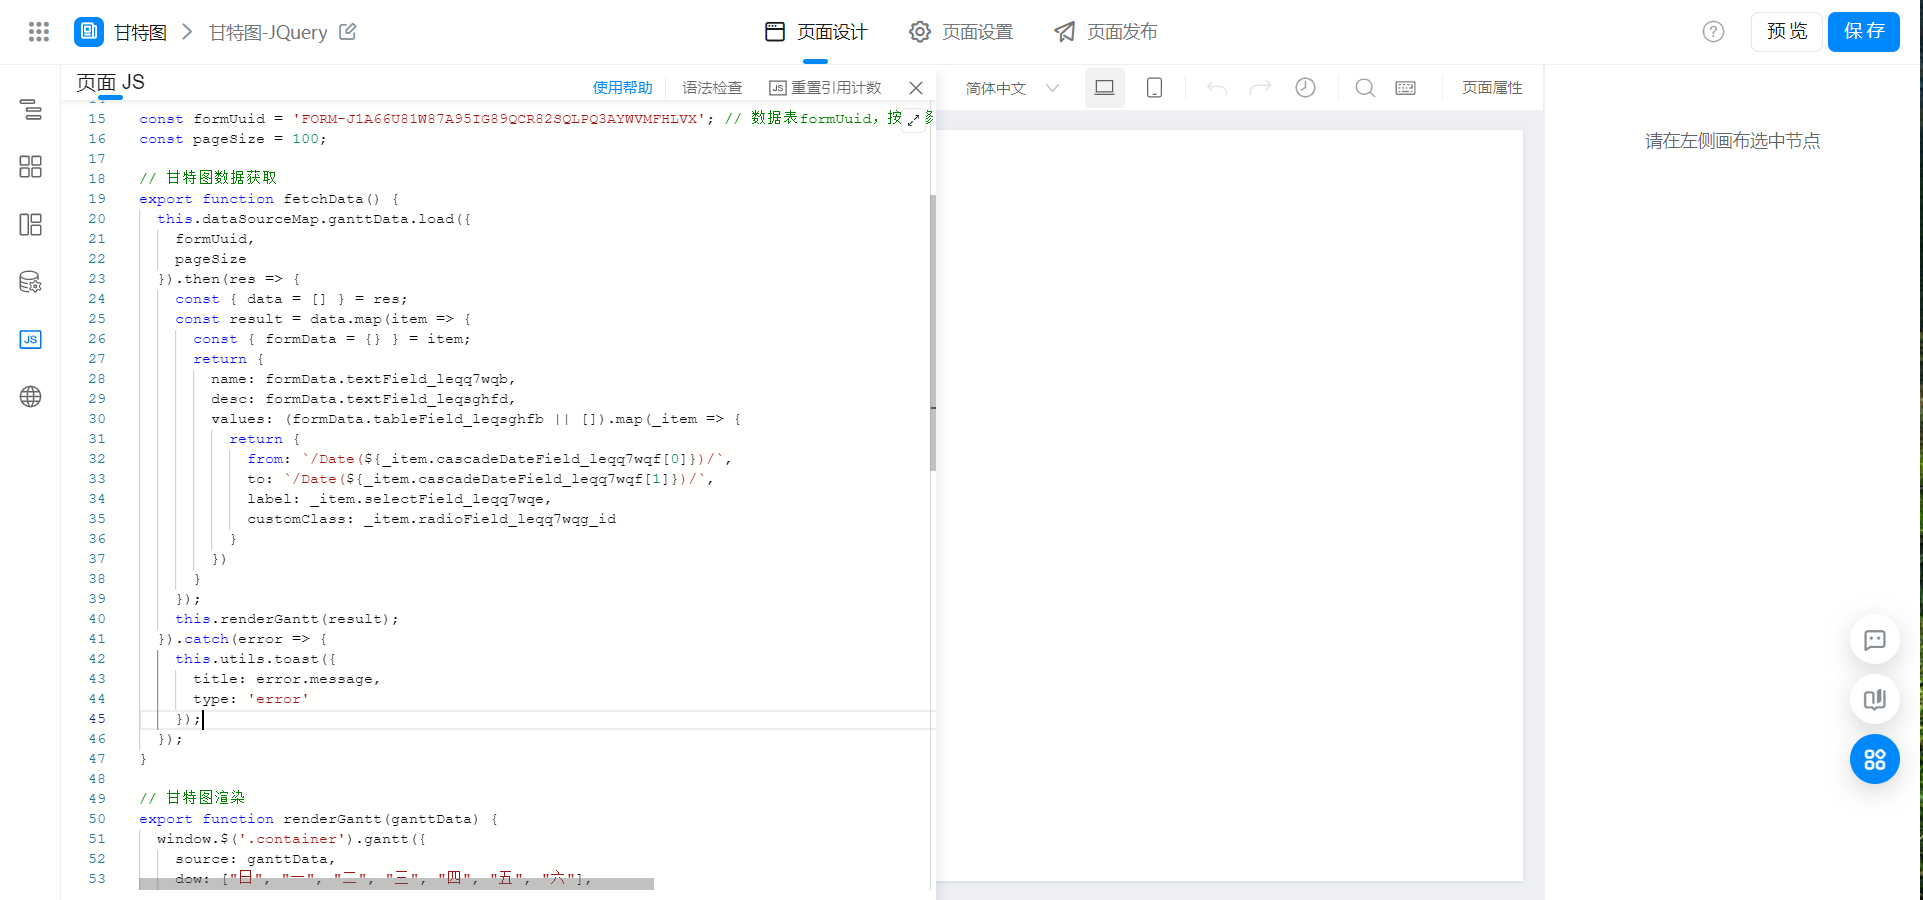
const formUuid = 'FORM-XXXXXXXX'; // 数据表formUuid,按需修改
const pageSize = 100;

// 甘特图数据获取
export function fetchData() {
  this.dataSourceMap.ganttData.load({
    formUuid,
    pageSize
  }).then(res => {
    const { data = [] } = res;
    const result = data.map(item => {
      const { formData = {} } = item;
      return {
        name: formData.textField_leqq7wqb,
        desc: formData.textField_leqsghfd,
        values: (formData.tableField_leqsghfb || []).map(_item => {
          return {
            from: `/Date(${_item.cascadeDateField_leqq7wqf[0]})/`,
            to: `/Date(${_item.cascadeDateField_leqq7wqf[1]})/`,
            label: _item.selectField_leqq7wqe,
            customClass: _item.radioField_leqq7wqg_id
          }
        })
      }
    });
    this.renderGantt(result);
  }).catch(error => {
    this.utils.toast({
      title: error.message,
      type: 'error'
    });
  });
}

// 甘特图渲染
export function renderGantt(ganttData) {
  window.$('.container').gantt({
    source: ganttData,
    dow: ["日", "一", "二", "三", "四", "五", "六"],
    months: ["一月", "二月", "三月", "四月", "五月", "六月", "七月", "八月", "九月", "十月", "十一月", "十二月"],
    navigate: 'scroll', // 底部使用的是拖拽进度还是按钮:scroll和buttons
    scale: "days", // 设置默认比例,选项:months  weeks days  hours
    maxScale: "months", // 最大比例,选项如上
    minScale: "days", // 最小比例,选项如上
    itemsPerPage: 999, // 甘特图每页的信息数量
    onItemClick: (data) => {
      // alert("Item clicked - show some details");
    },
    onAddClick: (dt, rowId) => {
      // alert("Empty space clicked - add an item!");
    },
    onRender: () => {
      if (window.console && typeof console.log === "function") {
        console.log("chart rendered");
      }
    }
  });
}
3. Achieve results
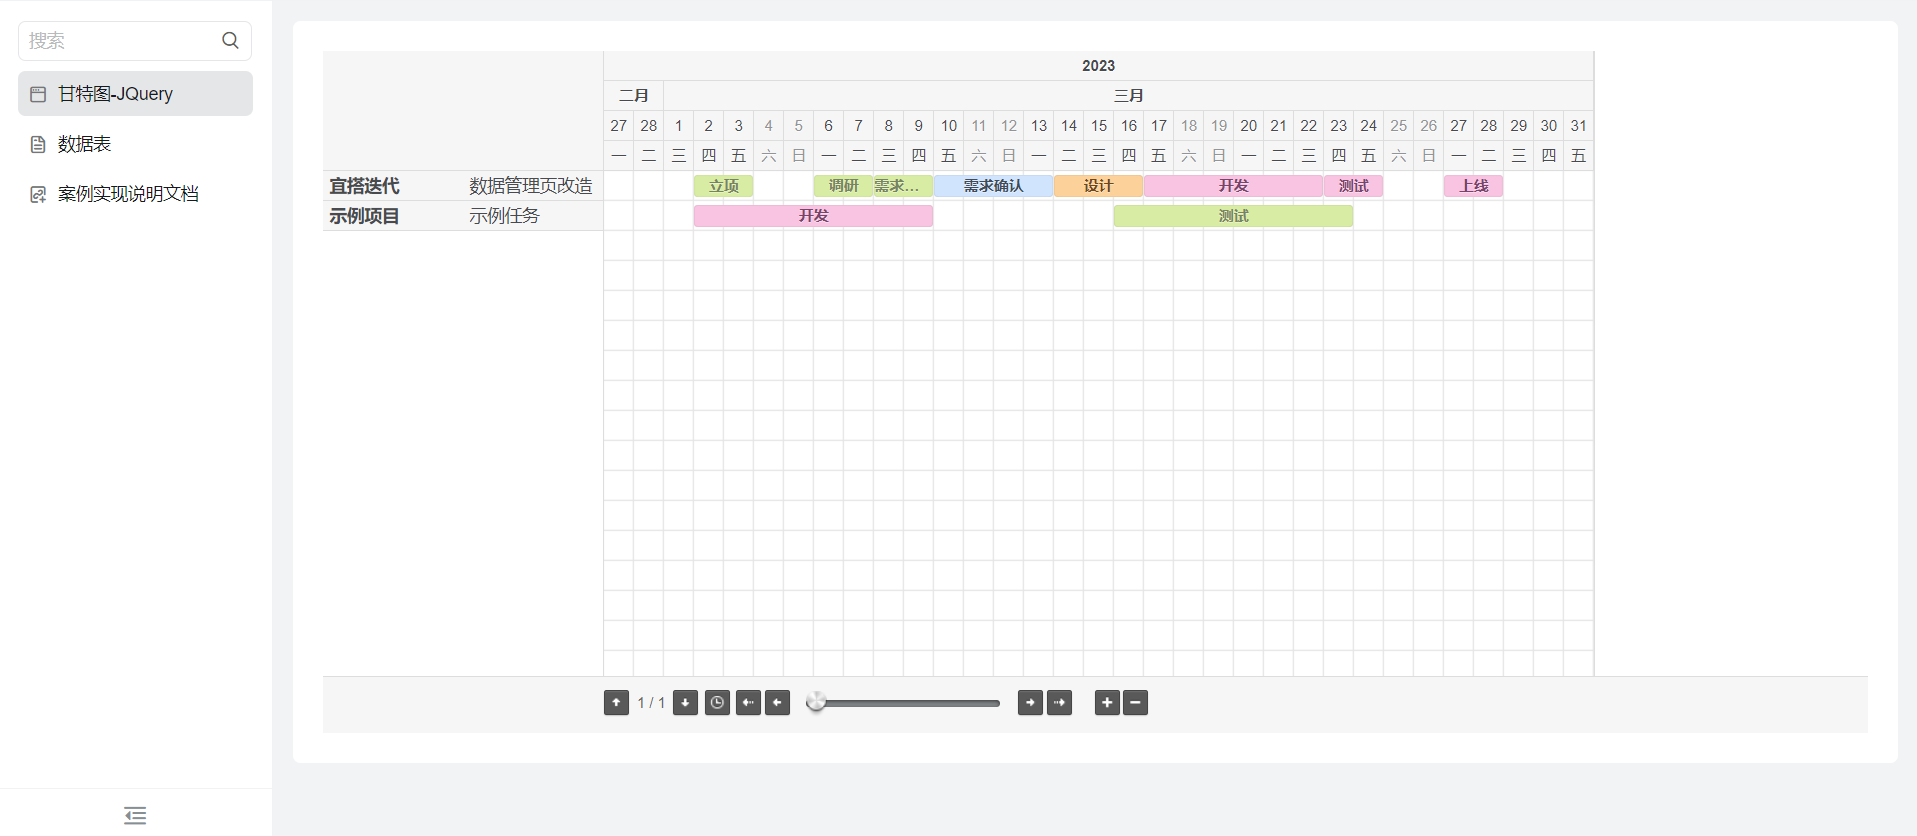
4. Try it online
This doc is generated using machine translation. Any discrepancies or differences created in the translation are not binding and have no legal effect for compliance or enforcement purposes.
Is this document helpful?
