Custom page introduction ECharts
1. Usage scenarios
This topic describes how to introduce external js to a custom page by introducing ECharts. JS to achieve visual display of internal data in YIDA.
2. Implement functions
2.1 create a custom page
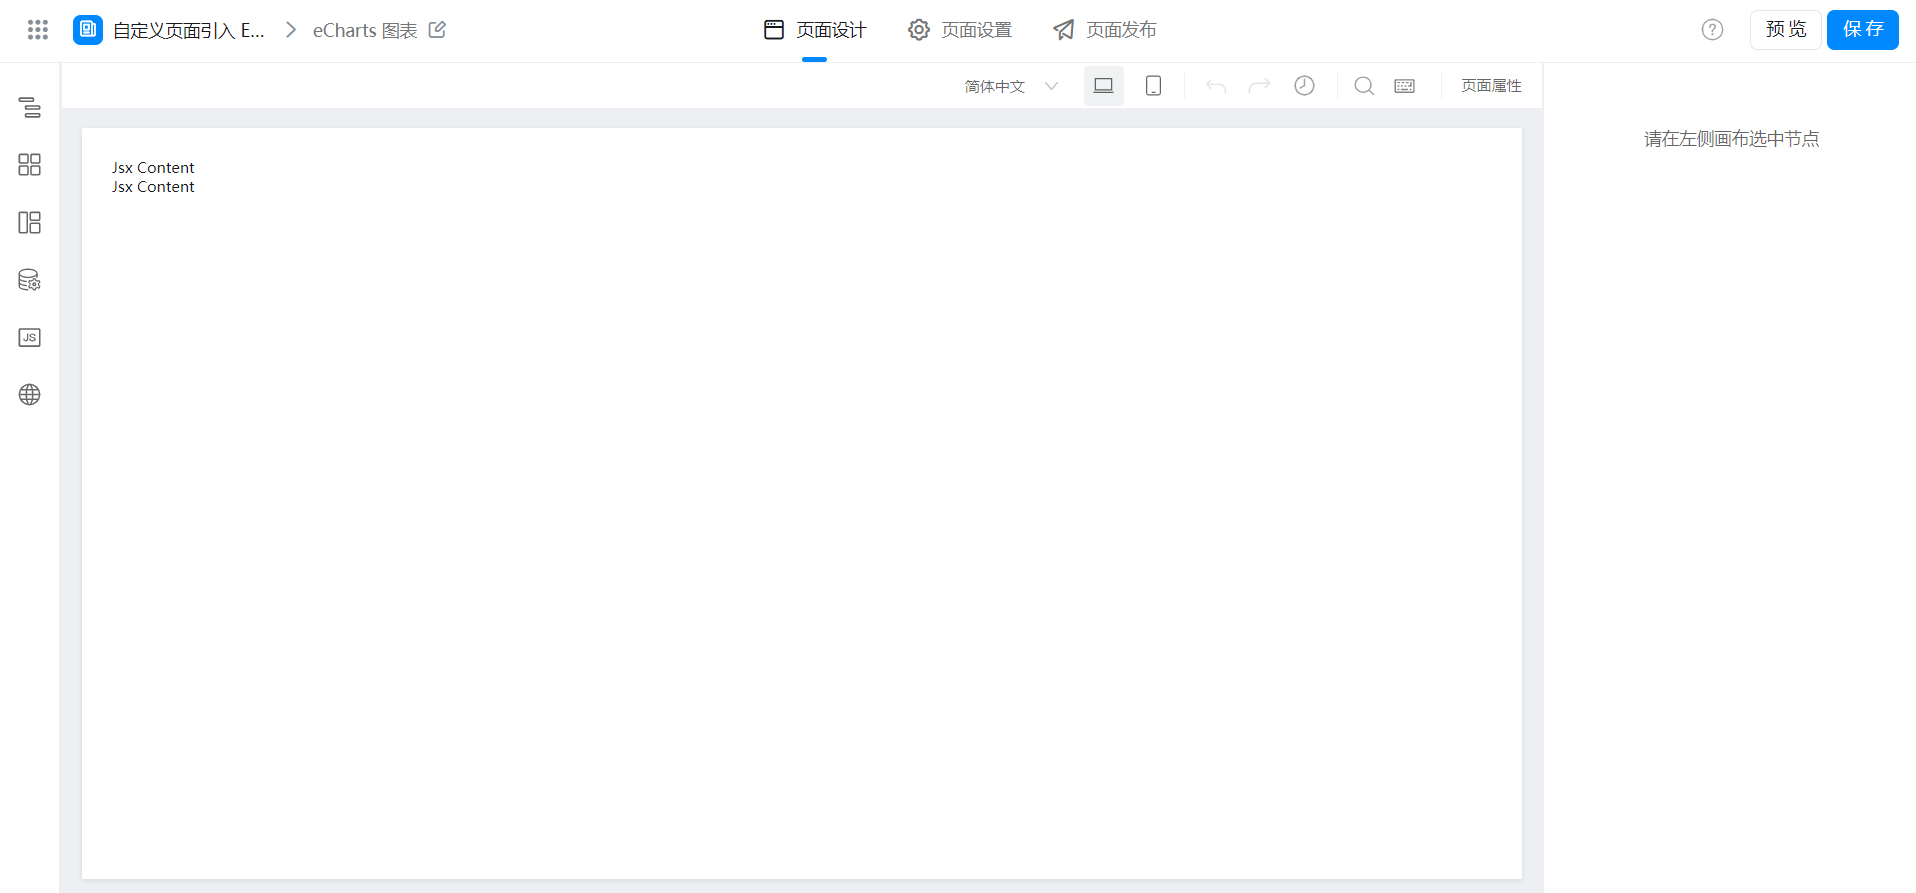
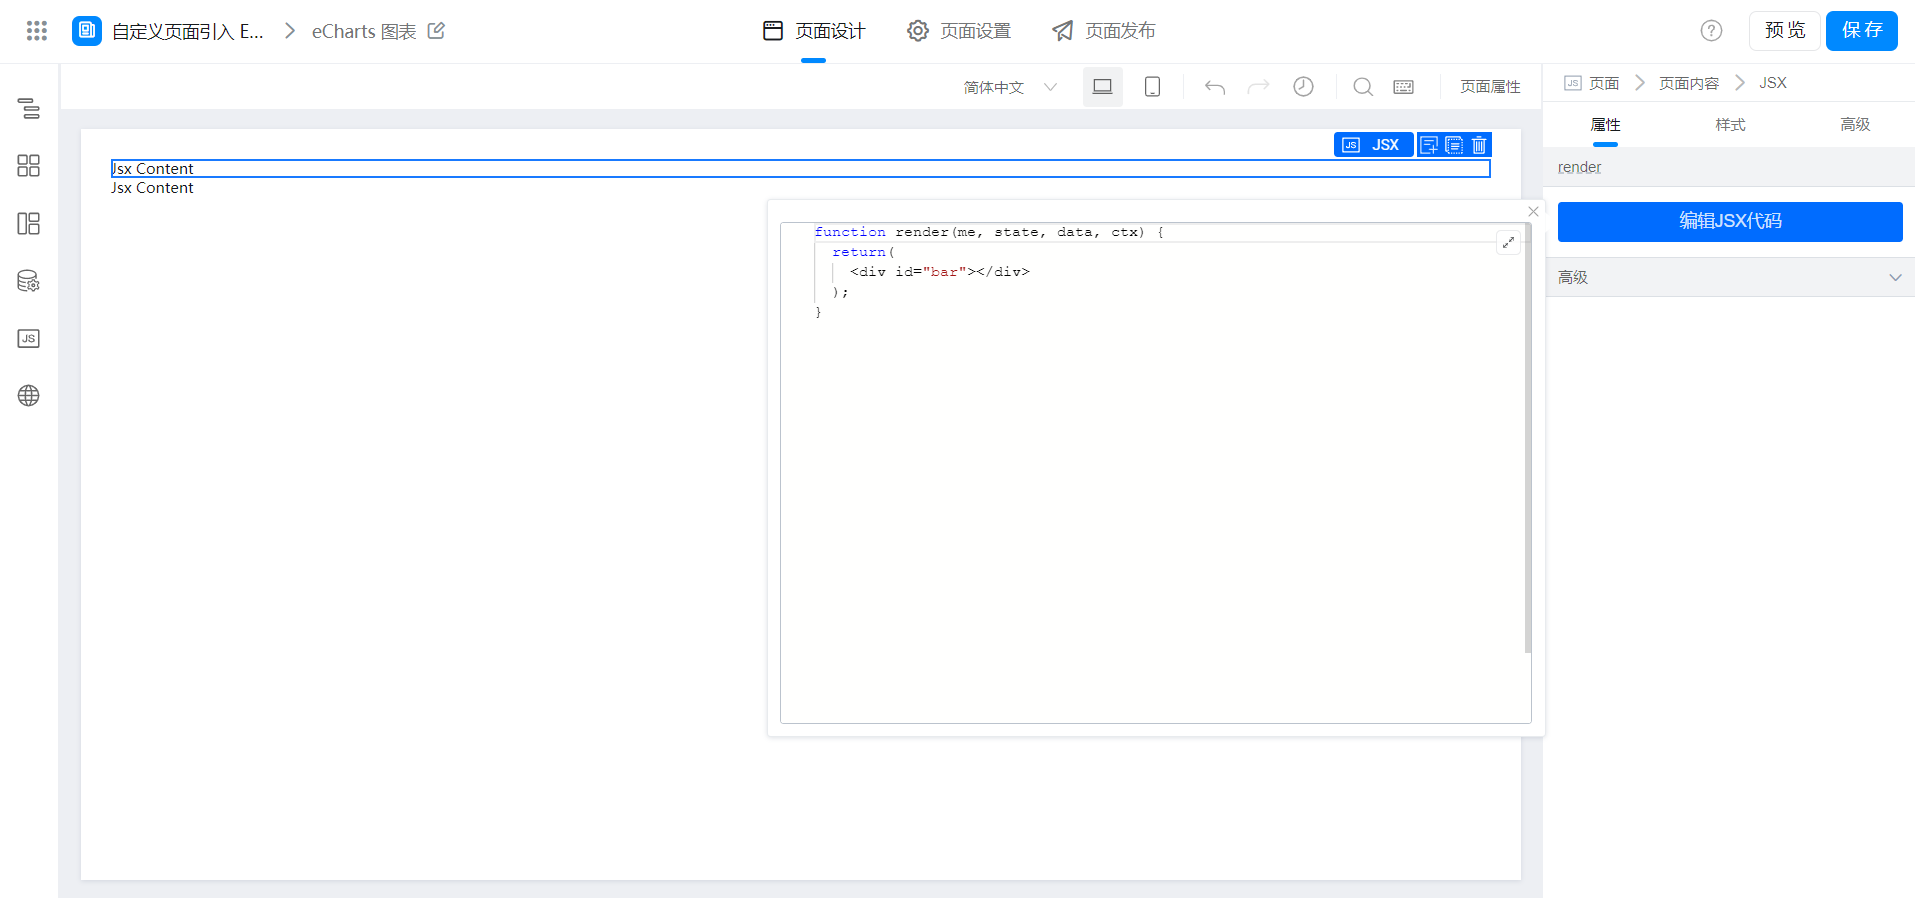
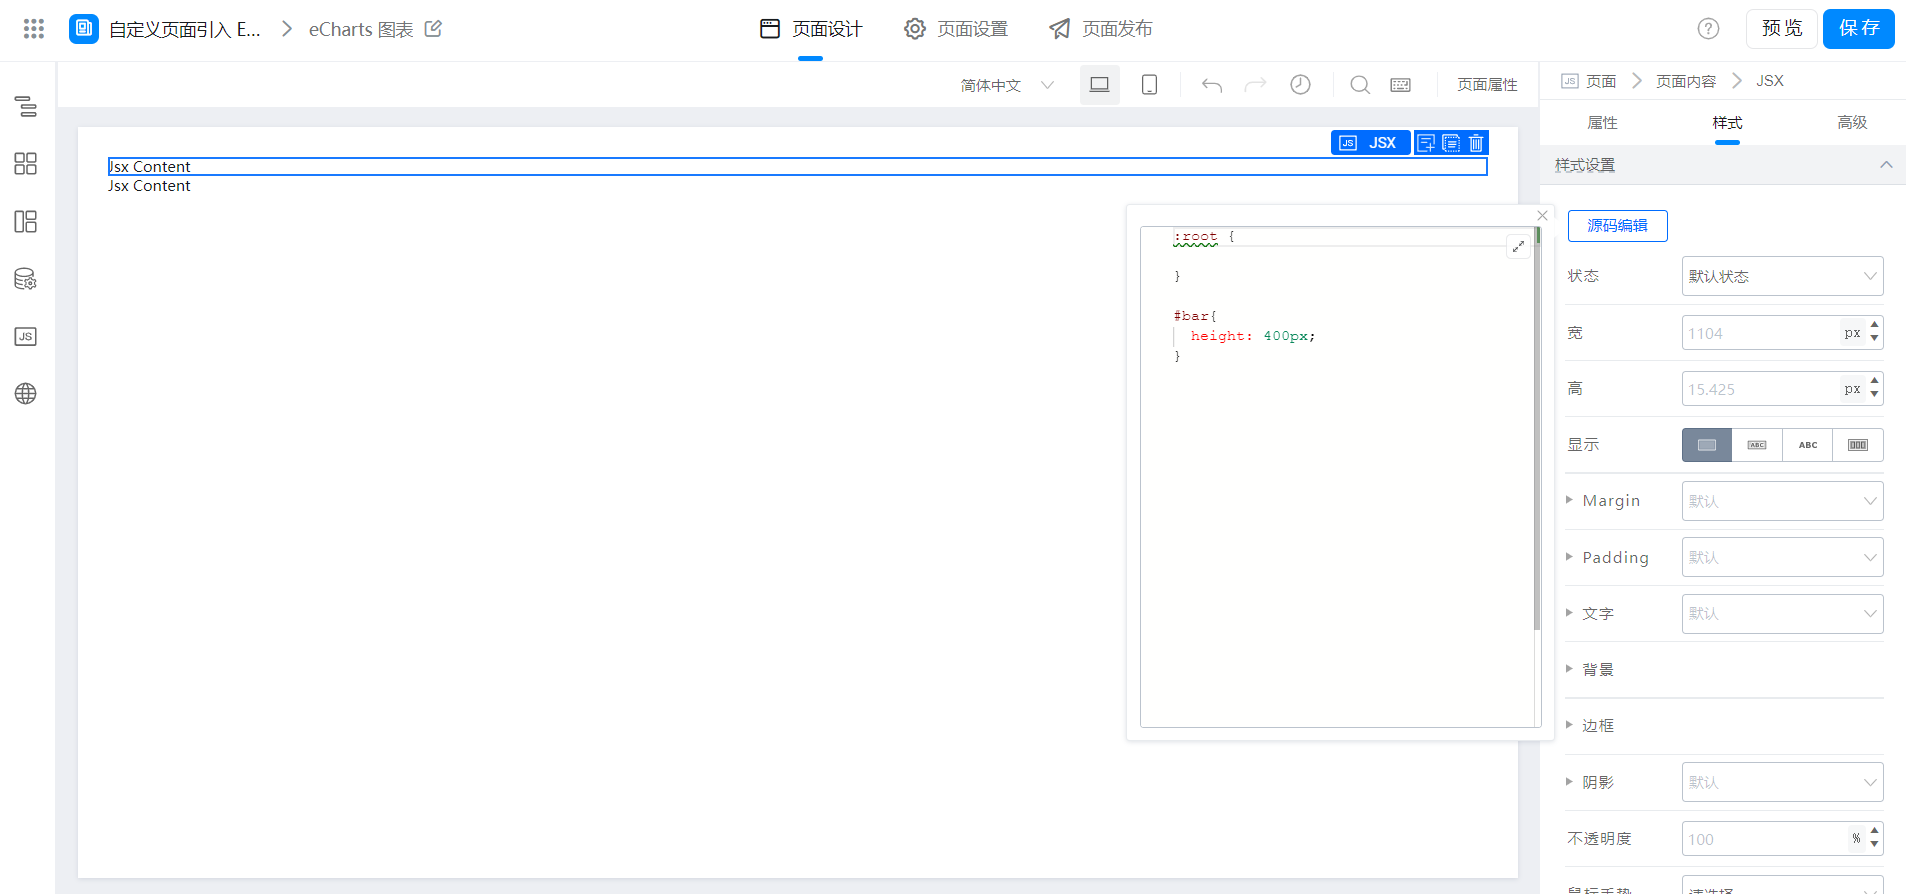
(1) JSX configuration of bar chart
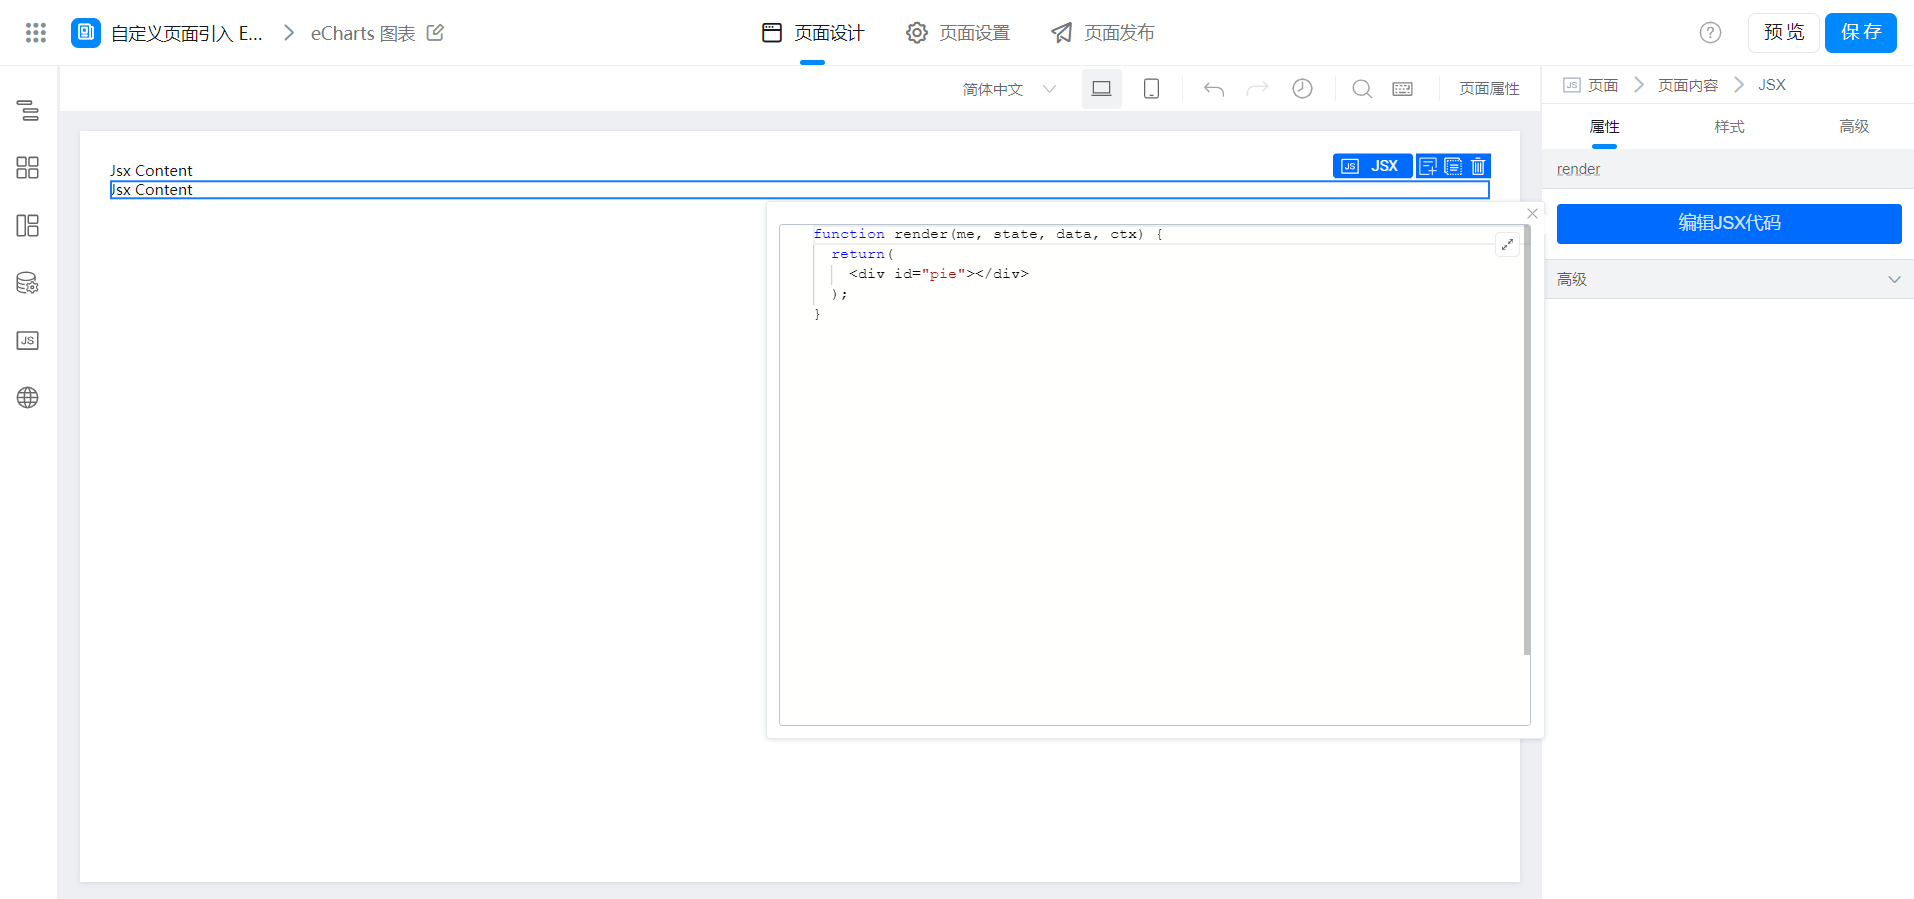
(2) JSX configuration of pie chart

2.2 configure custom pages
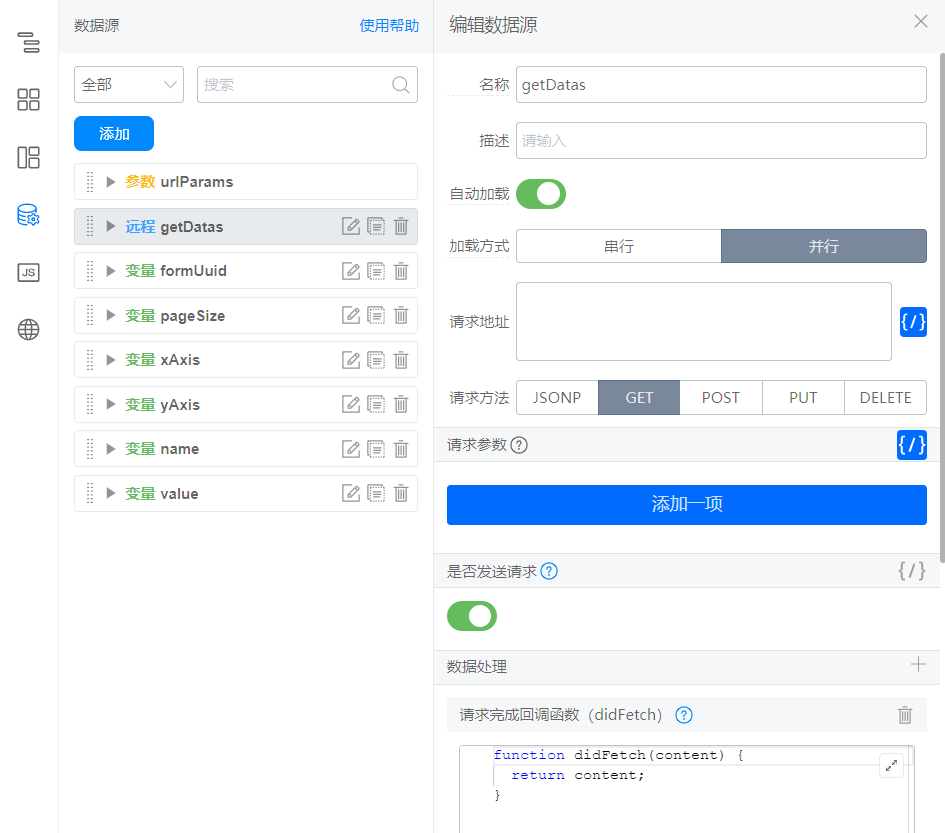
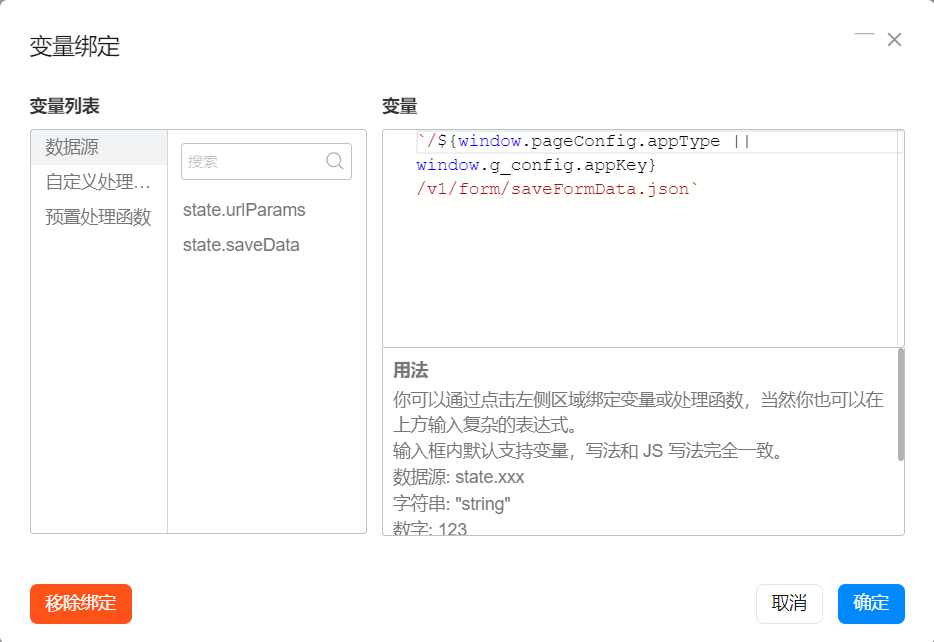
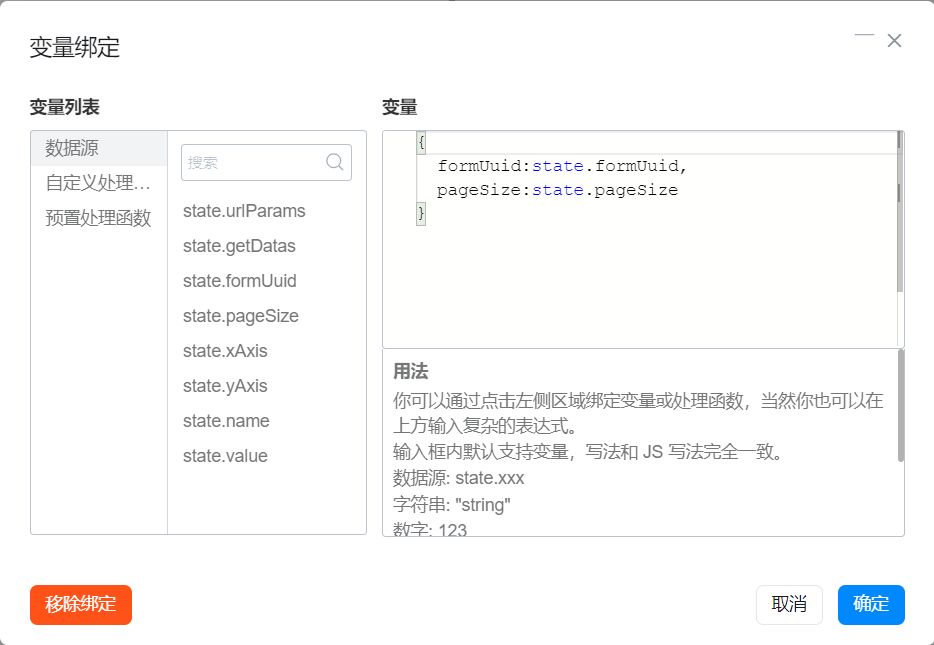
(1) add a remote data source at the data source
Reference documents:Search form instance details by criteria
The interface configuration is as follows:
(2) load ECharts.js and render histogram and pie chart
ECharts.js CDN address: https://g.alicdn.com/code/lib/echarts/5.4.0/echarts.min.js
ECharts.js Chinese documentation:https://echarts.apache.org/examples/zh/index.html
The code is as follows:
export function didMount() {
  this.utils.loadScript("https://g.alicdn.com/code/lib/echarts/5.4.0/echarts.min.js").then(() => {
    console.log("success");
    //此处写三方JS资源
    const { getDatas } = this.state;
    this.bar(this.handleBarData(getDatas));
    this.pie(this.handlePieData(getDatas));
  });
}

// 柱状图数据格式处理
export function handleBarData(content) {
  const { data } = content;
  const { xAxis, yAxis } = this.state;
  const result = {};
  data.forEach(item => {
    const { formData = {} } = item;
    if (!result[formData[xAxis]]) {
      result[formData[xAxis]] = (formData[yAxis] || 0);
      return;
    };
    result[formData[xAxis]] += (formData[yAxis] || 0);
  });
  console.log('bar', result);
  return result;
}

// 饼图数据格式处理
export function handlePieData(content) {
  const { data } = content;
  const { name, value } = this.state;
  const dataObj = {};
  data.forEach(item => {
    const { formData = {} } = item;
    if (!dataObj[formData[name]]) {
      dataObj[formData[name]] = (formData[value] || 0);
      return;
    };
    dataObj[formData[name]] += (formData[value] || 0);
  });
  const result = Object.keys(dataObj).map(item => {
    return {
      name: item,
      value: dataObj[item]
    }
  });
  console.log('pie', result);
  return result;
}

// 柱状图
export function bar(datas) {
  var chartDom = document.getElementById('bar');
  var myChart = echarts.init(chartDom);
  var option;
  option = {
    title: {
      text: '柱状图',
    },
    tooltip: {
      trigger: 'axis',
      axisPointer: {
        type: 'shadow'
      },
    },
    xAxis: {
      type: 'category',
      data: Object.keys(datas),
    },
    yAxis: {
      type: 'value'
    },
    series: [
      {
        name: '总数:',
        data: Object.values(datas),
        type: 'bar',
        label: {
          show: true,
          position: 'inside'
        }
      }
    ]
  };

  option && myChart.setOption(option);
}

// 饼图
export function pie(datas) {
  var chartDom = document.getElementById('pie');
  var myChart = echarts.init(chartDom);
  var option;
  option = {
    title: {
      text: '饼图',
      left: 'center'
    },
    tooltip: {
      trigger: 'item'
    },
    legend: {
      orient: 'vertical',
      left: 'left'
    },
    series: [
      {
        type: 'pie',
        radius: '50%',
        data: datas,
        emphasis: {
          itemStyle: {
            shadowBlur: 10,
            shadowOffsetX: 0,
            shadowColor: 'rgba(0, 0, 0, 0.5)'
          }
        }
      }
    ]
  };

  option && myChart.setOption(option);
}
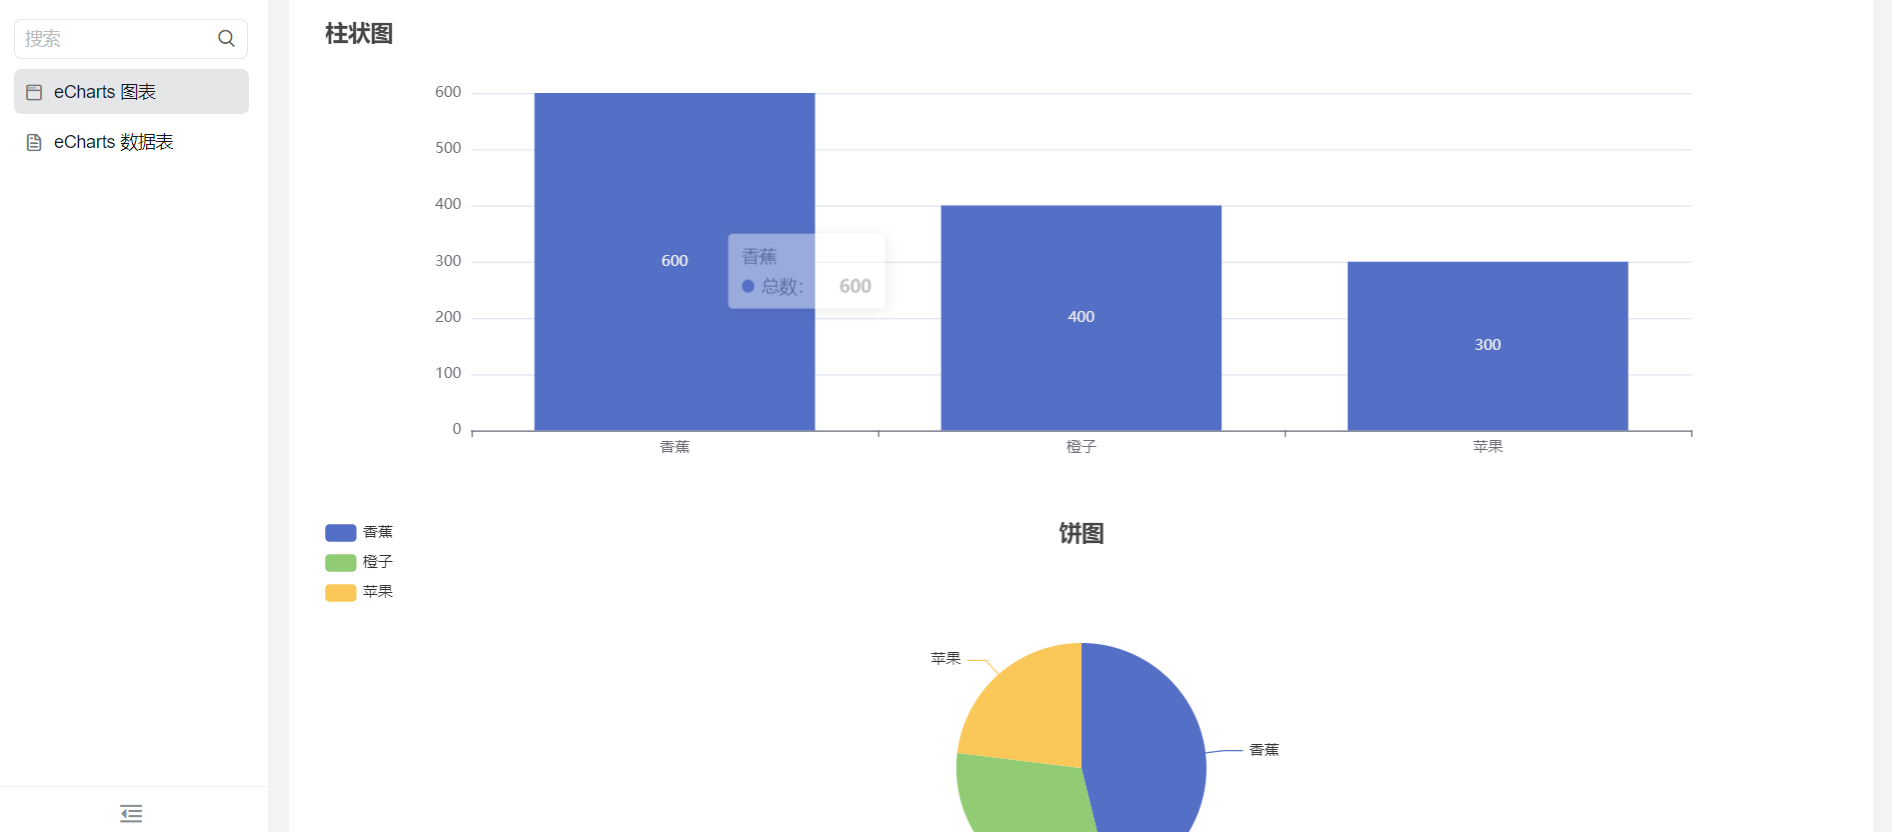
3. Achieve results
4. Try it online

This doc is generated using machine translation. Any discrepancies or differences created in the translation are not binding and have no legal effect for compliance or enforcement purposes.
Is this document helpful?