Implement Formula field participation condition filtering based on chart
1. Case Background
At this stage, YIDA when the report table component uses forms as data sets, formula Fields added to table columns cannot participate in conditional filtering. However, in actual business scenarios, table fields are often calculated and filtered. For example, filter the date component data in the form and the time difference result of the current date when the report page is opened to calculate the report data.
2. Effect demonstration
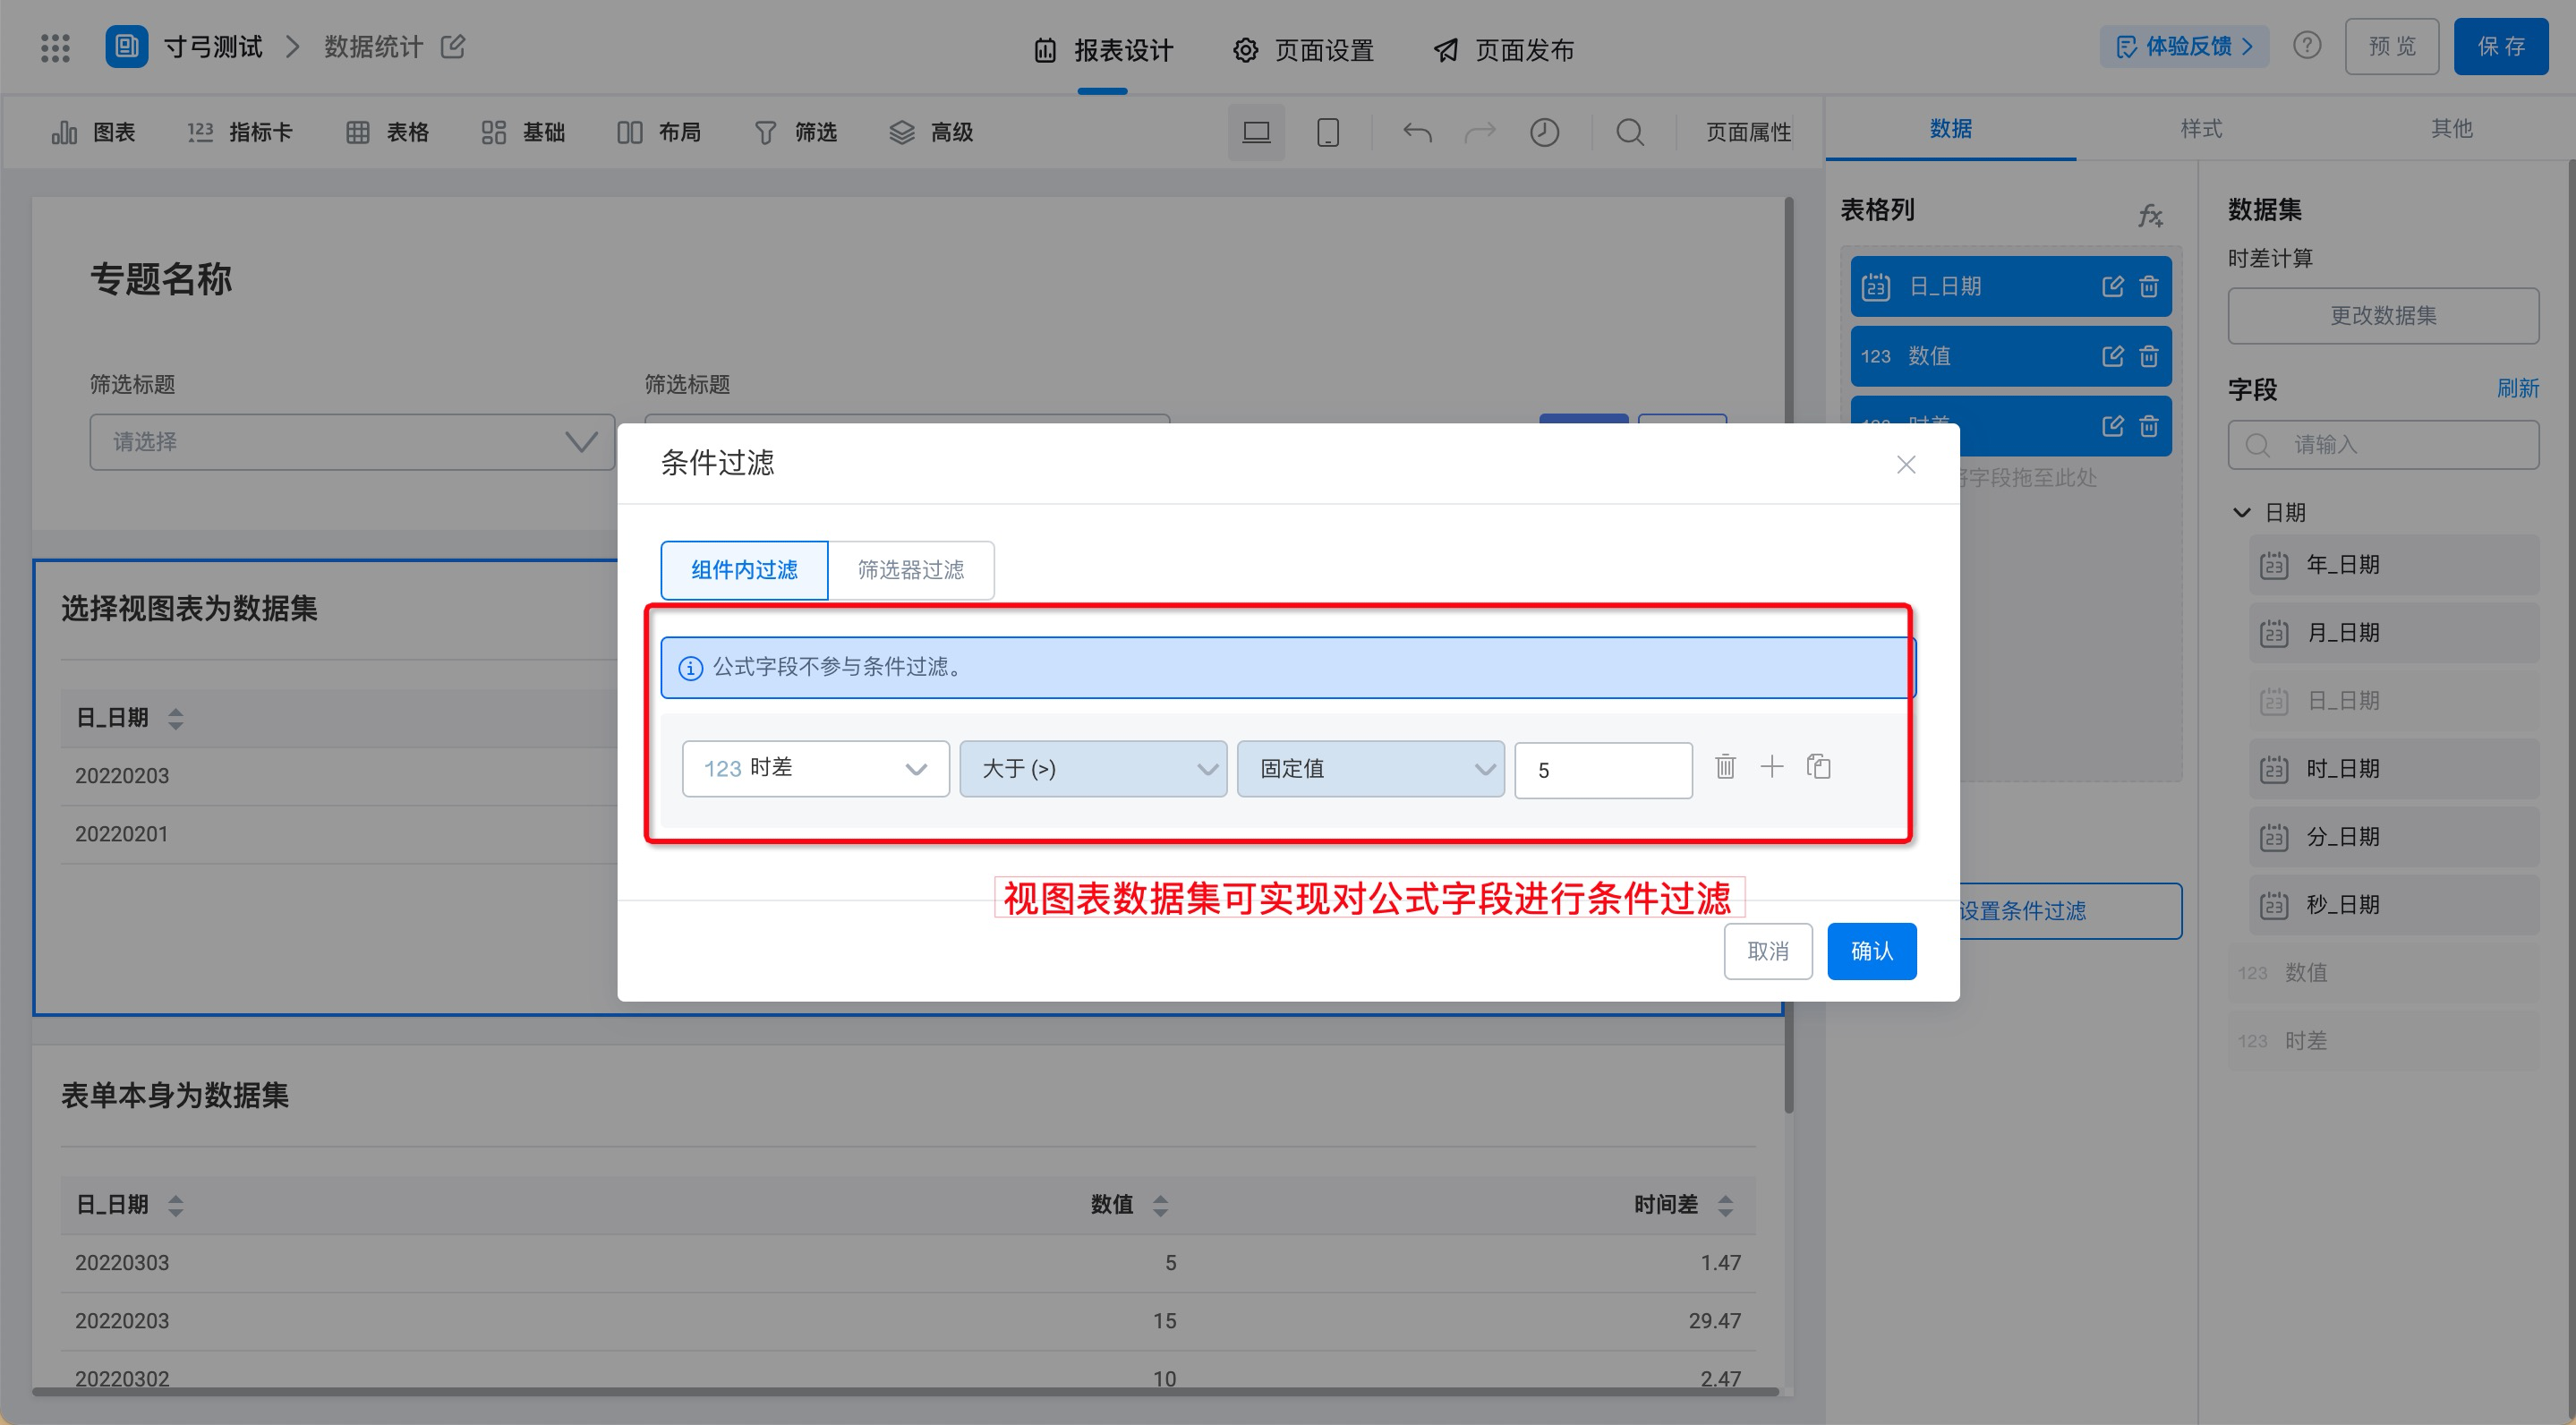
3. Procedure
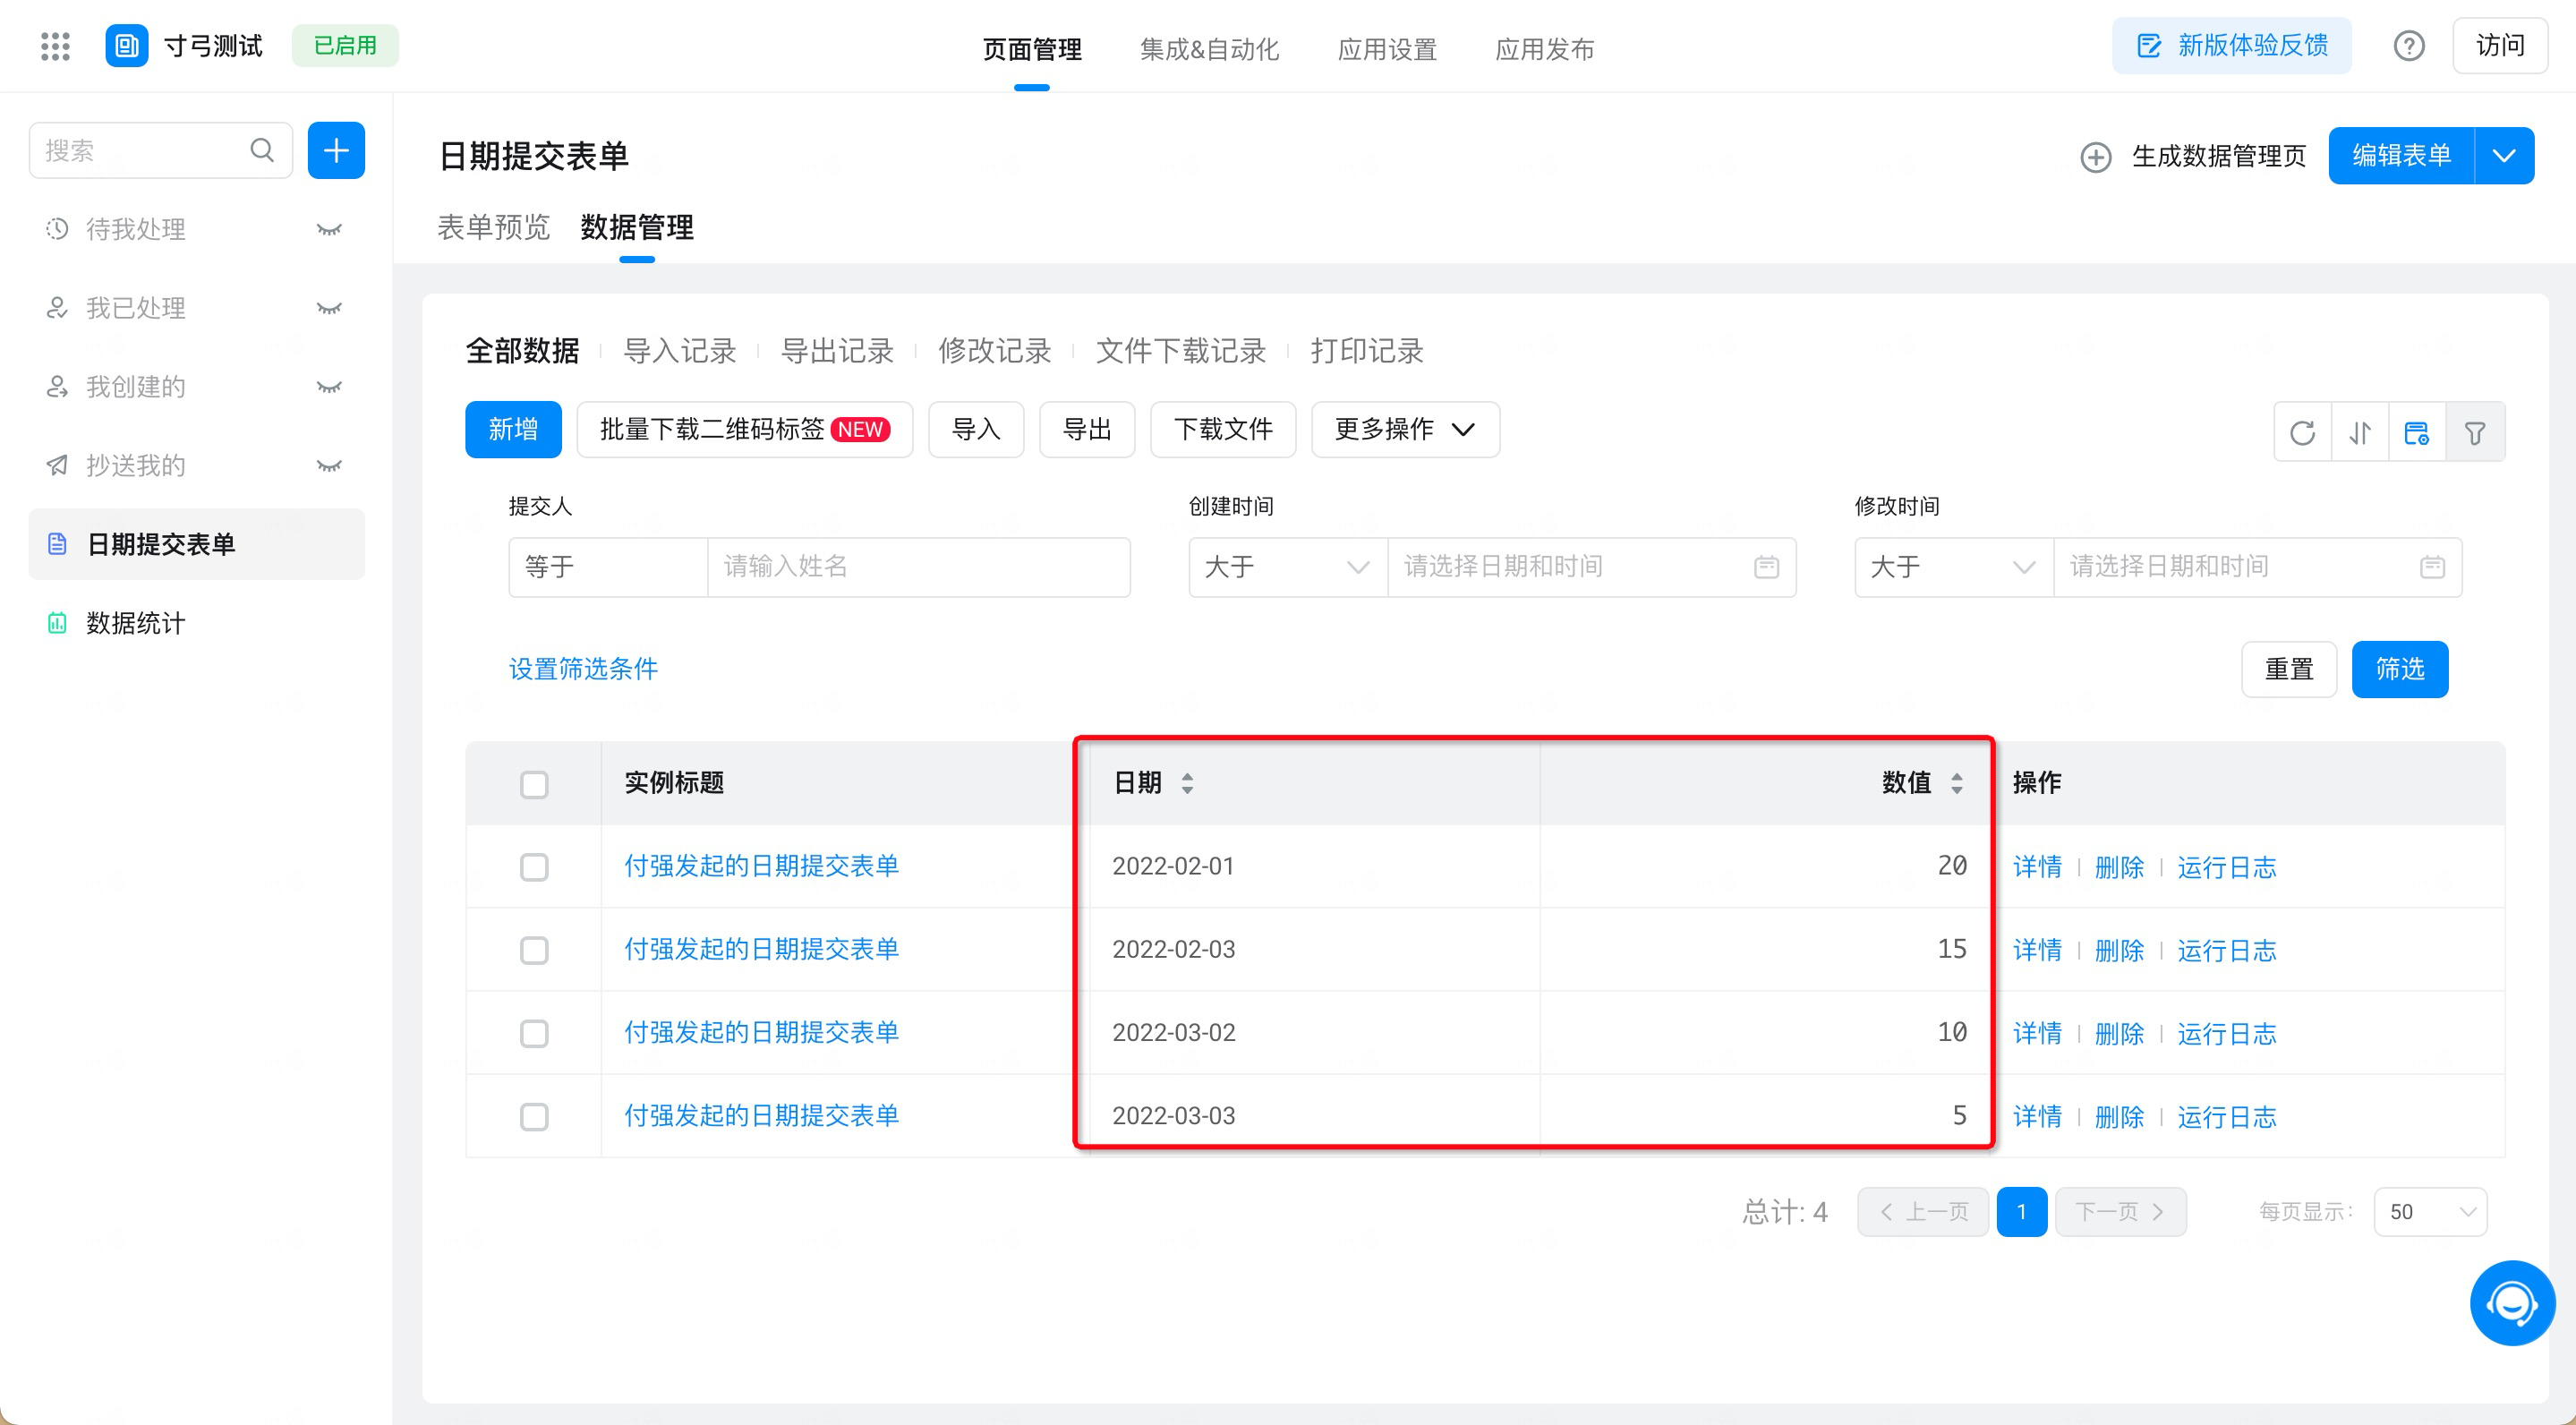
3.1 submit form data
Add date components and numeric components to the form and submit data. (As shown in the figure below)
3.2 Create a View chart
Further reading:For more information, see,View chart.
Calculate data by looking at charts.
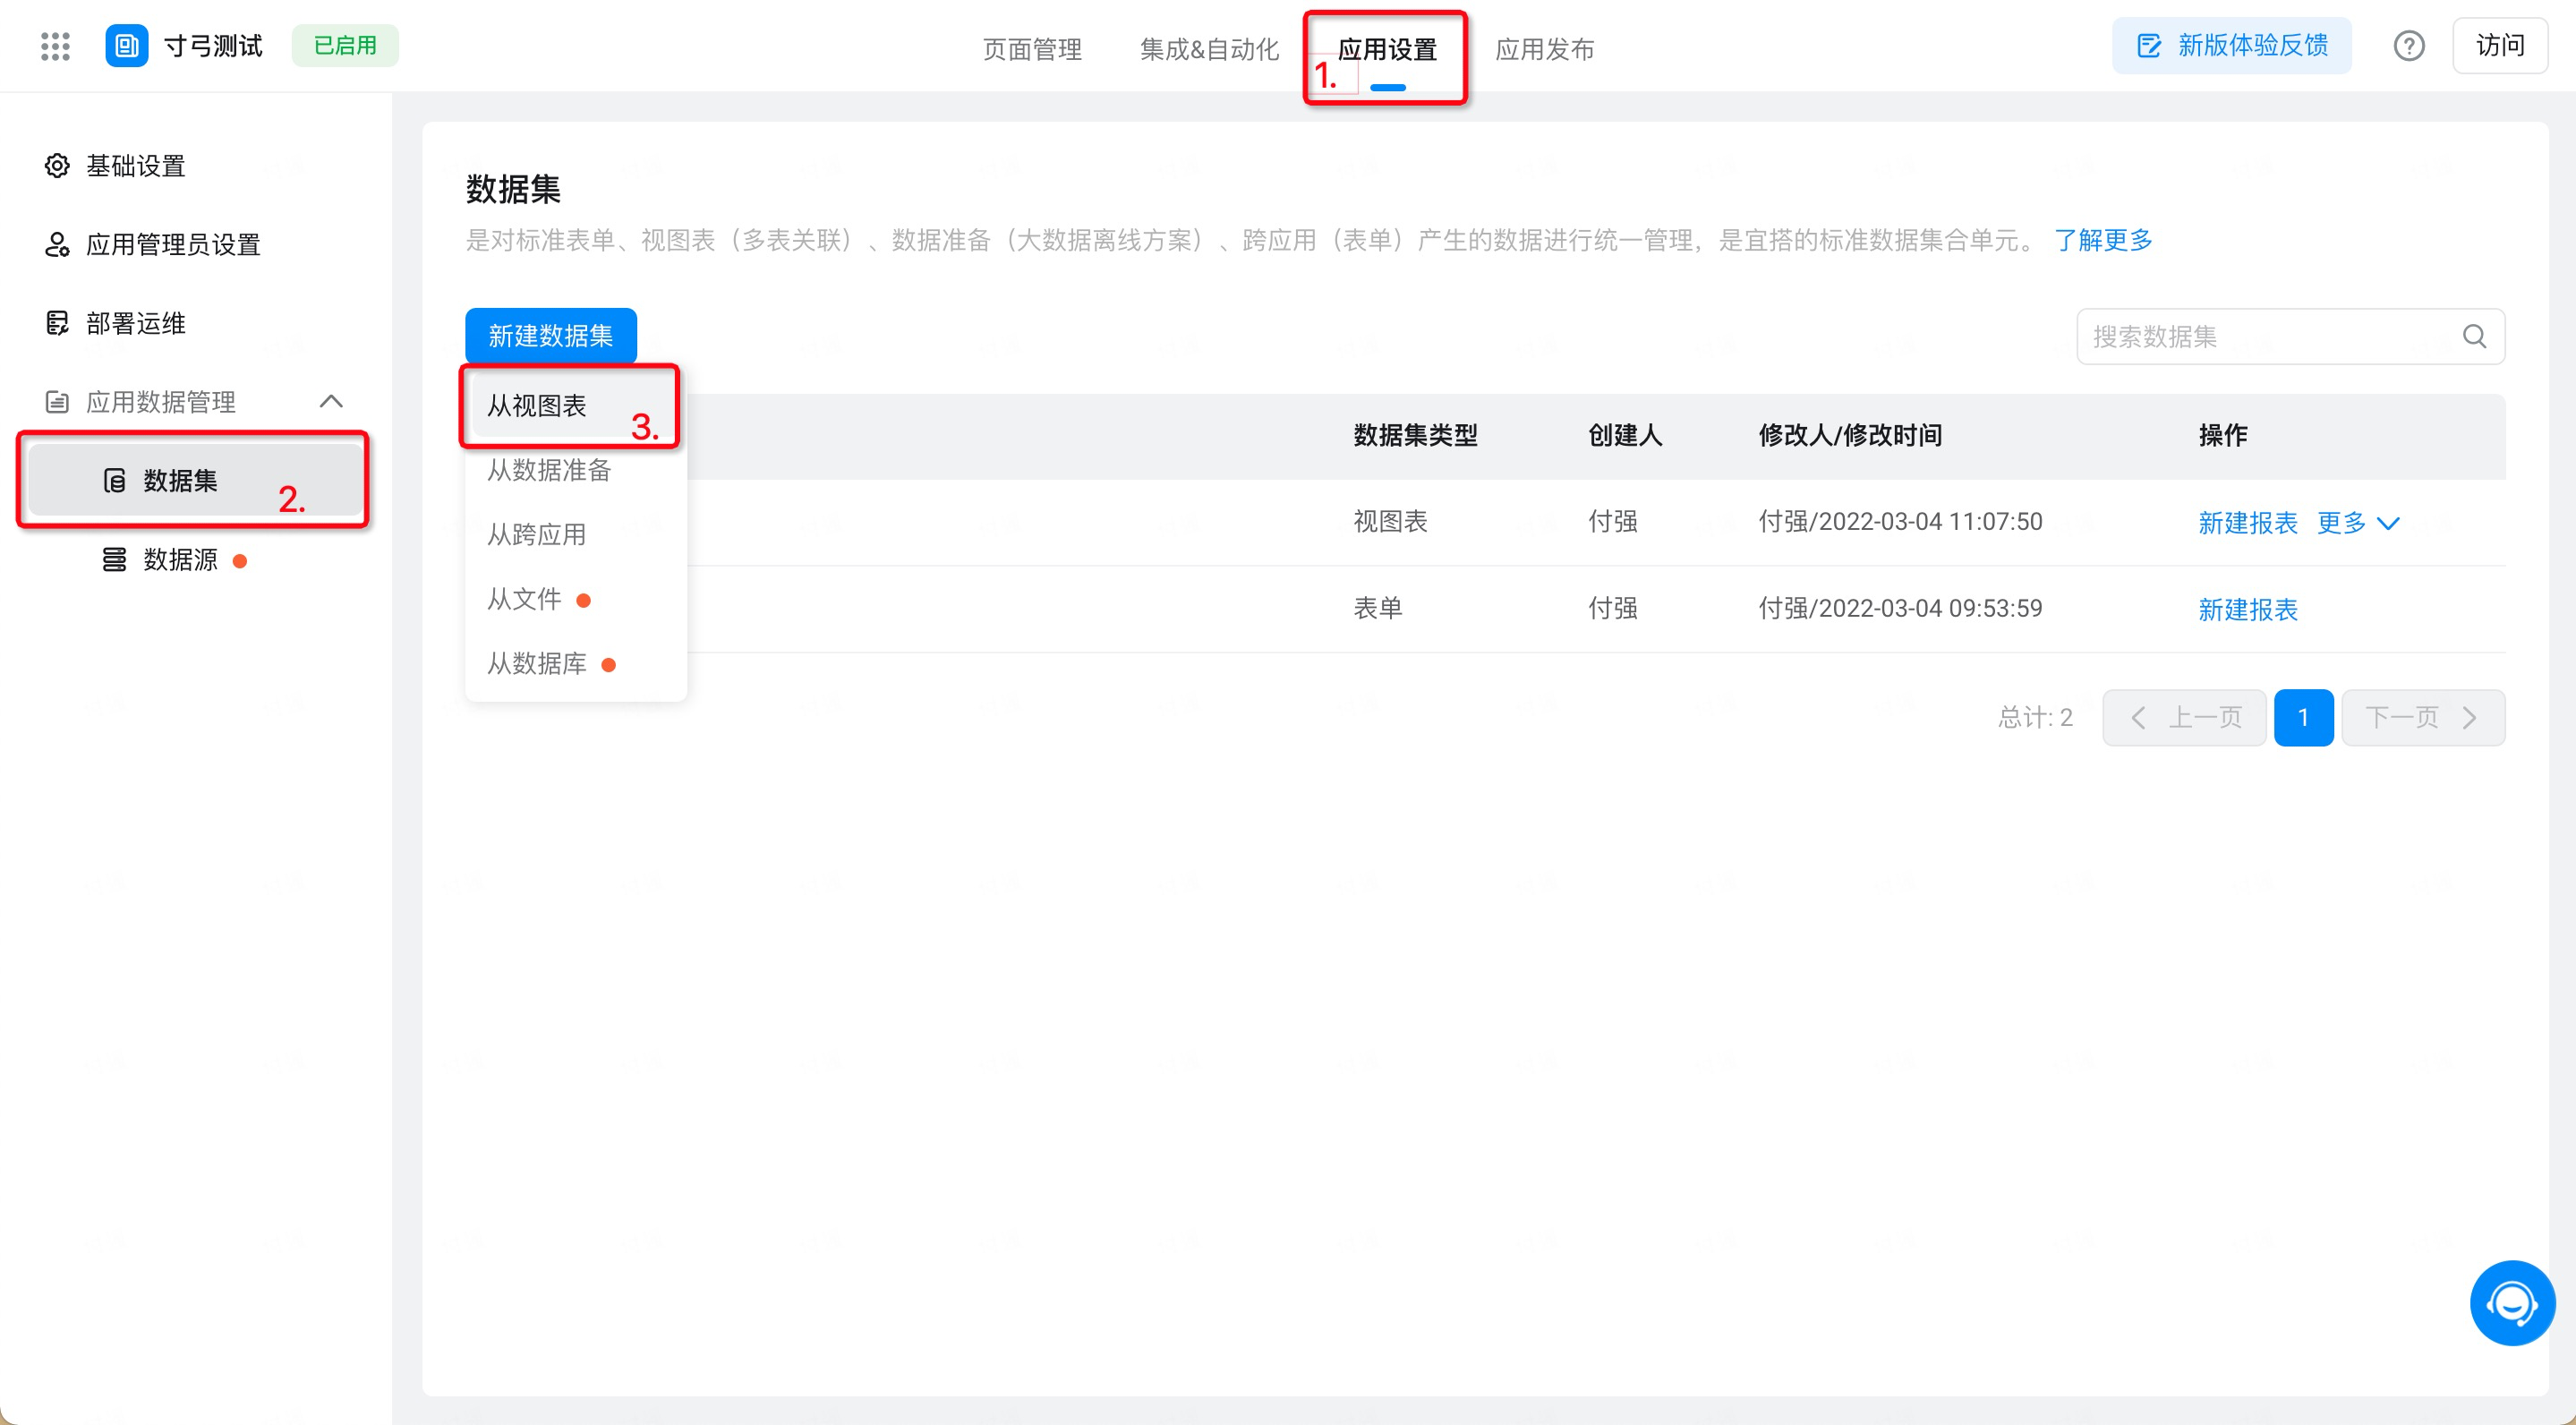
Procedure:
- Page Setup> dataset> create dataset> view from chart (as shown in the following figure)
- Select dataset> configure table column (as shown in the following figure)
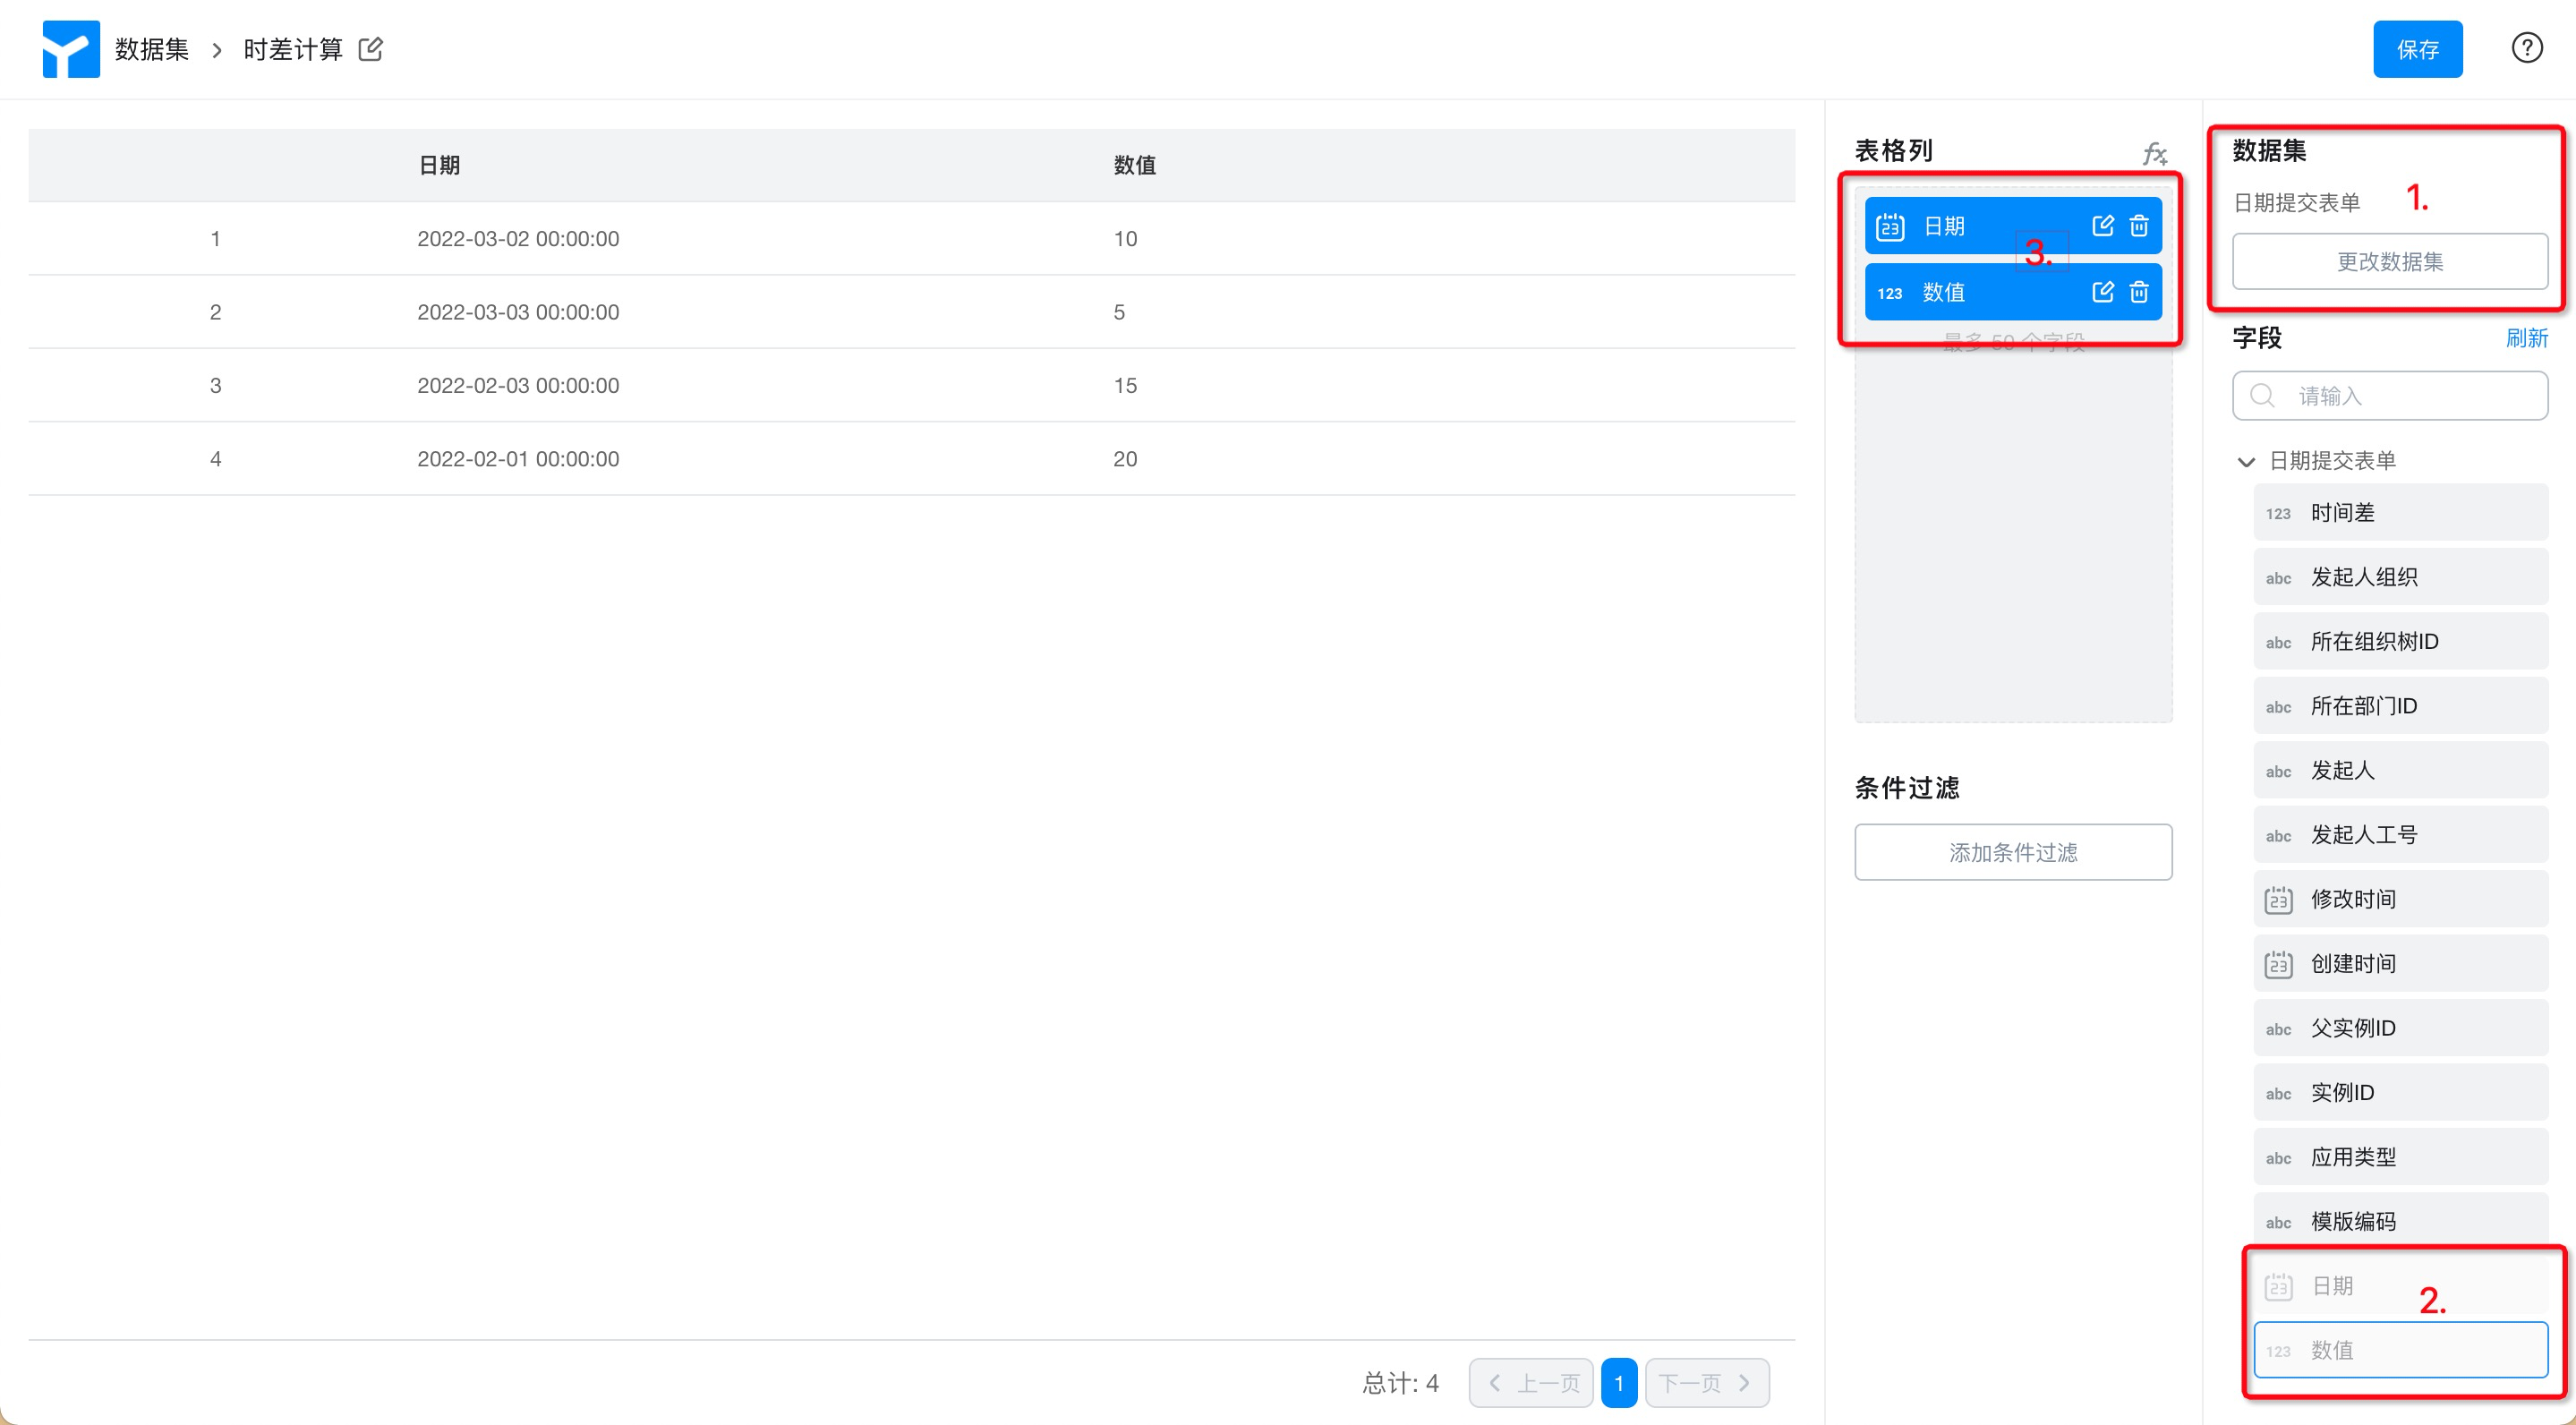
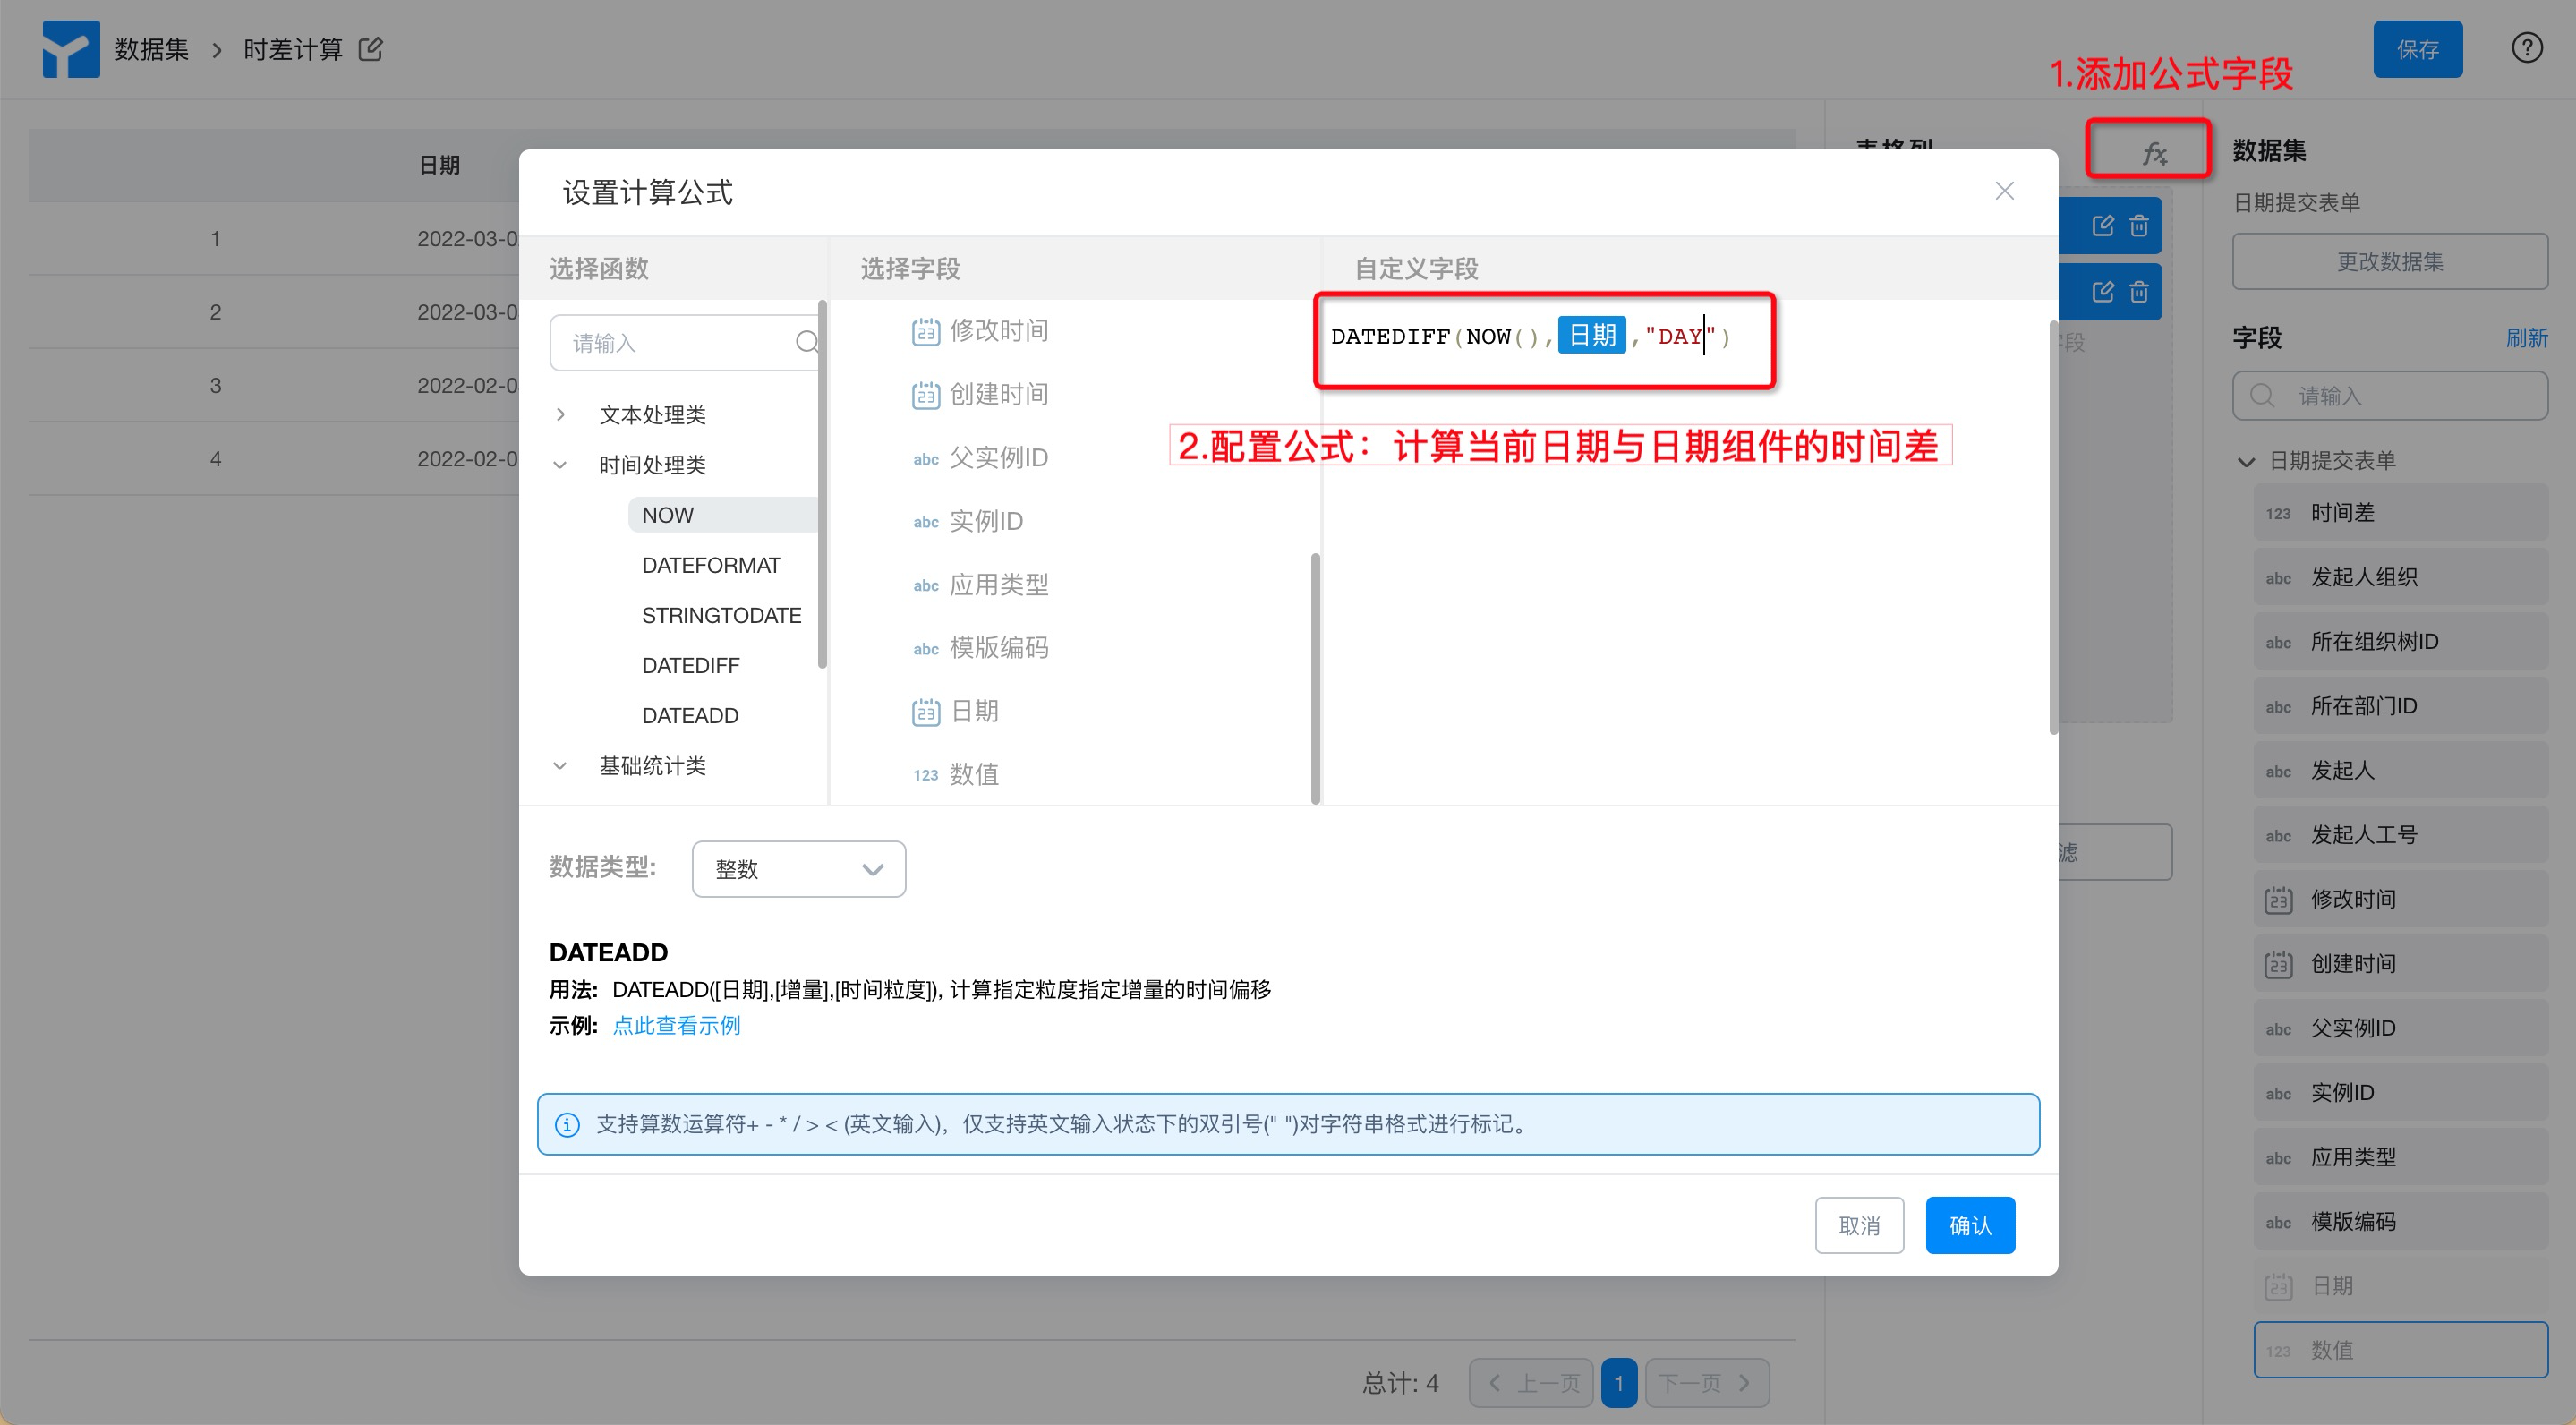
- Add formula field> Save (as shown in the following figure)
3.3 Create report page
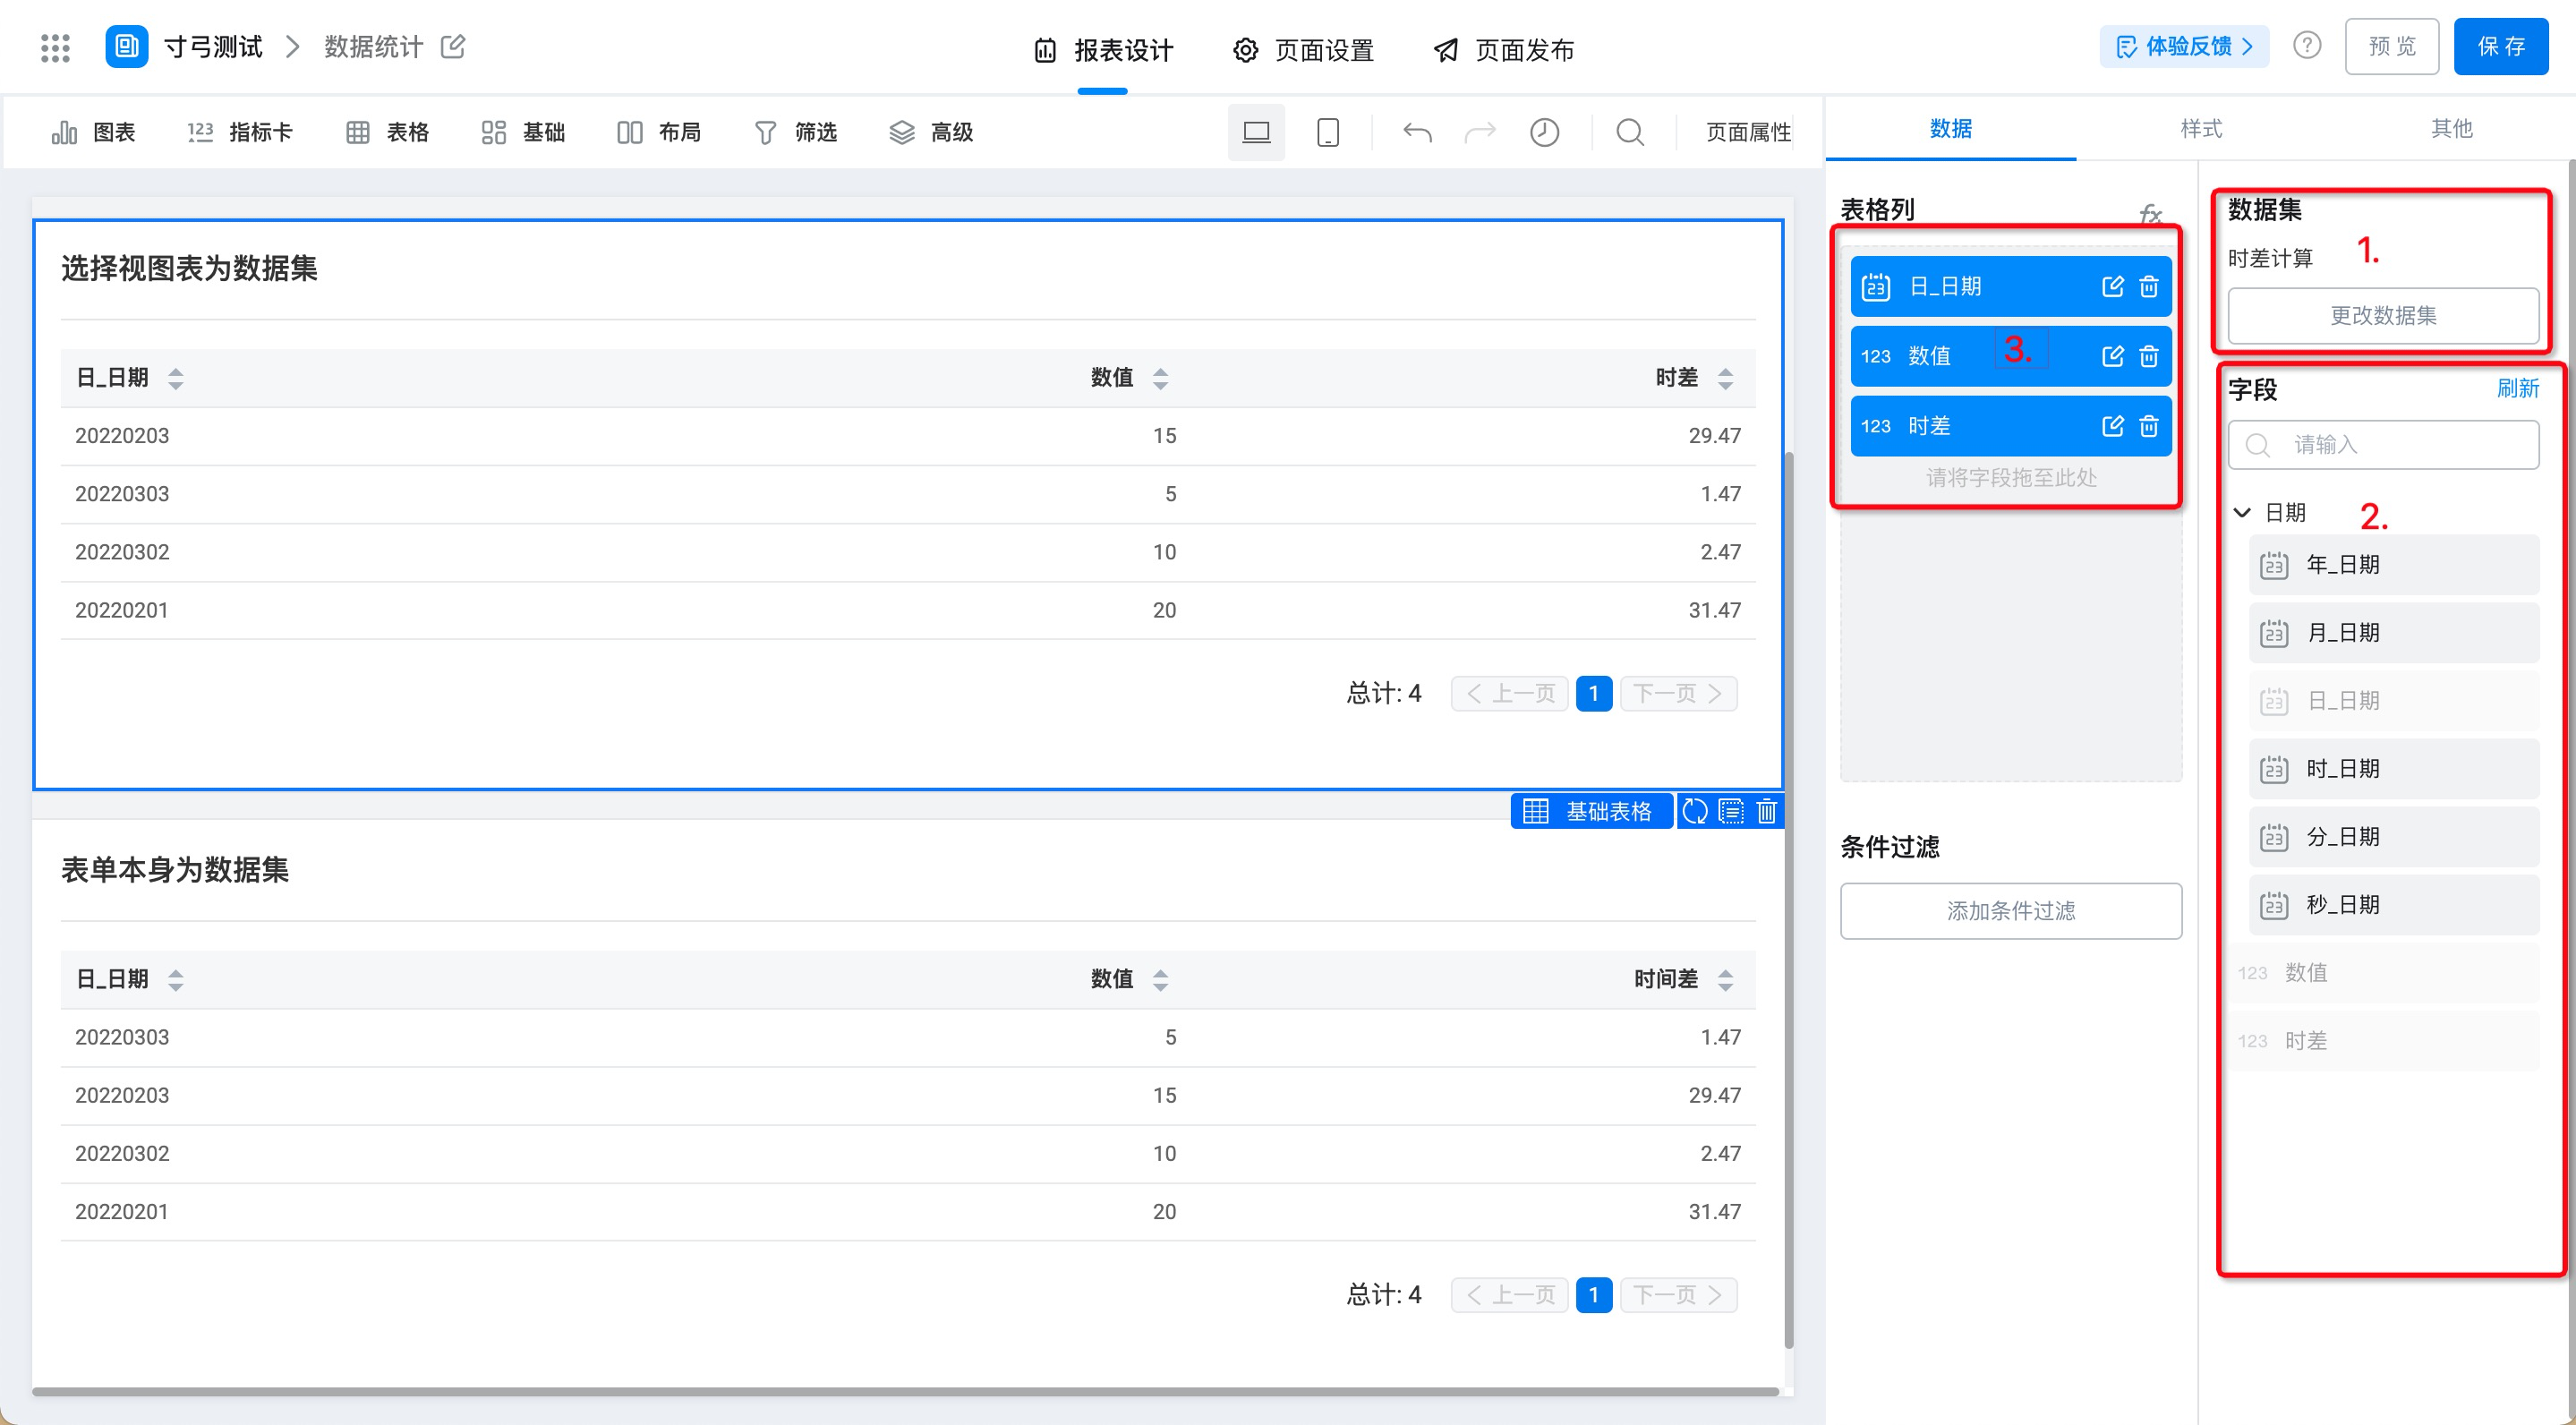
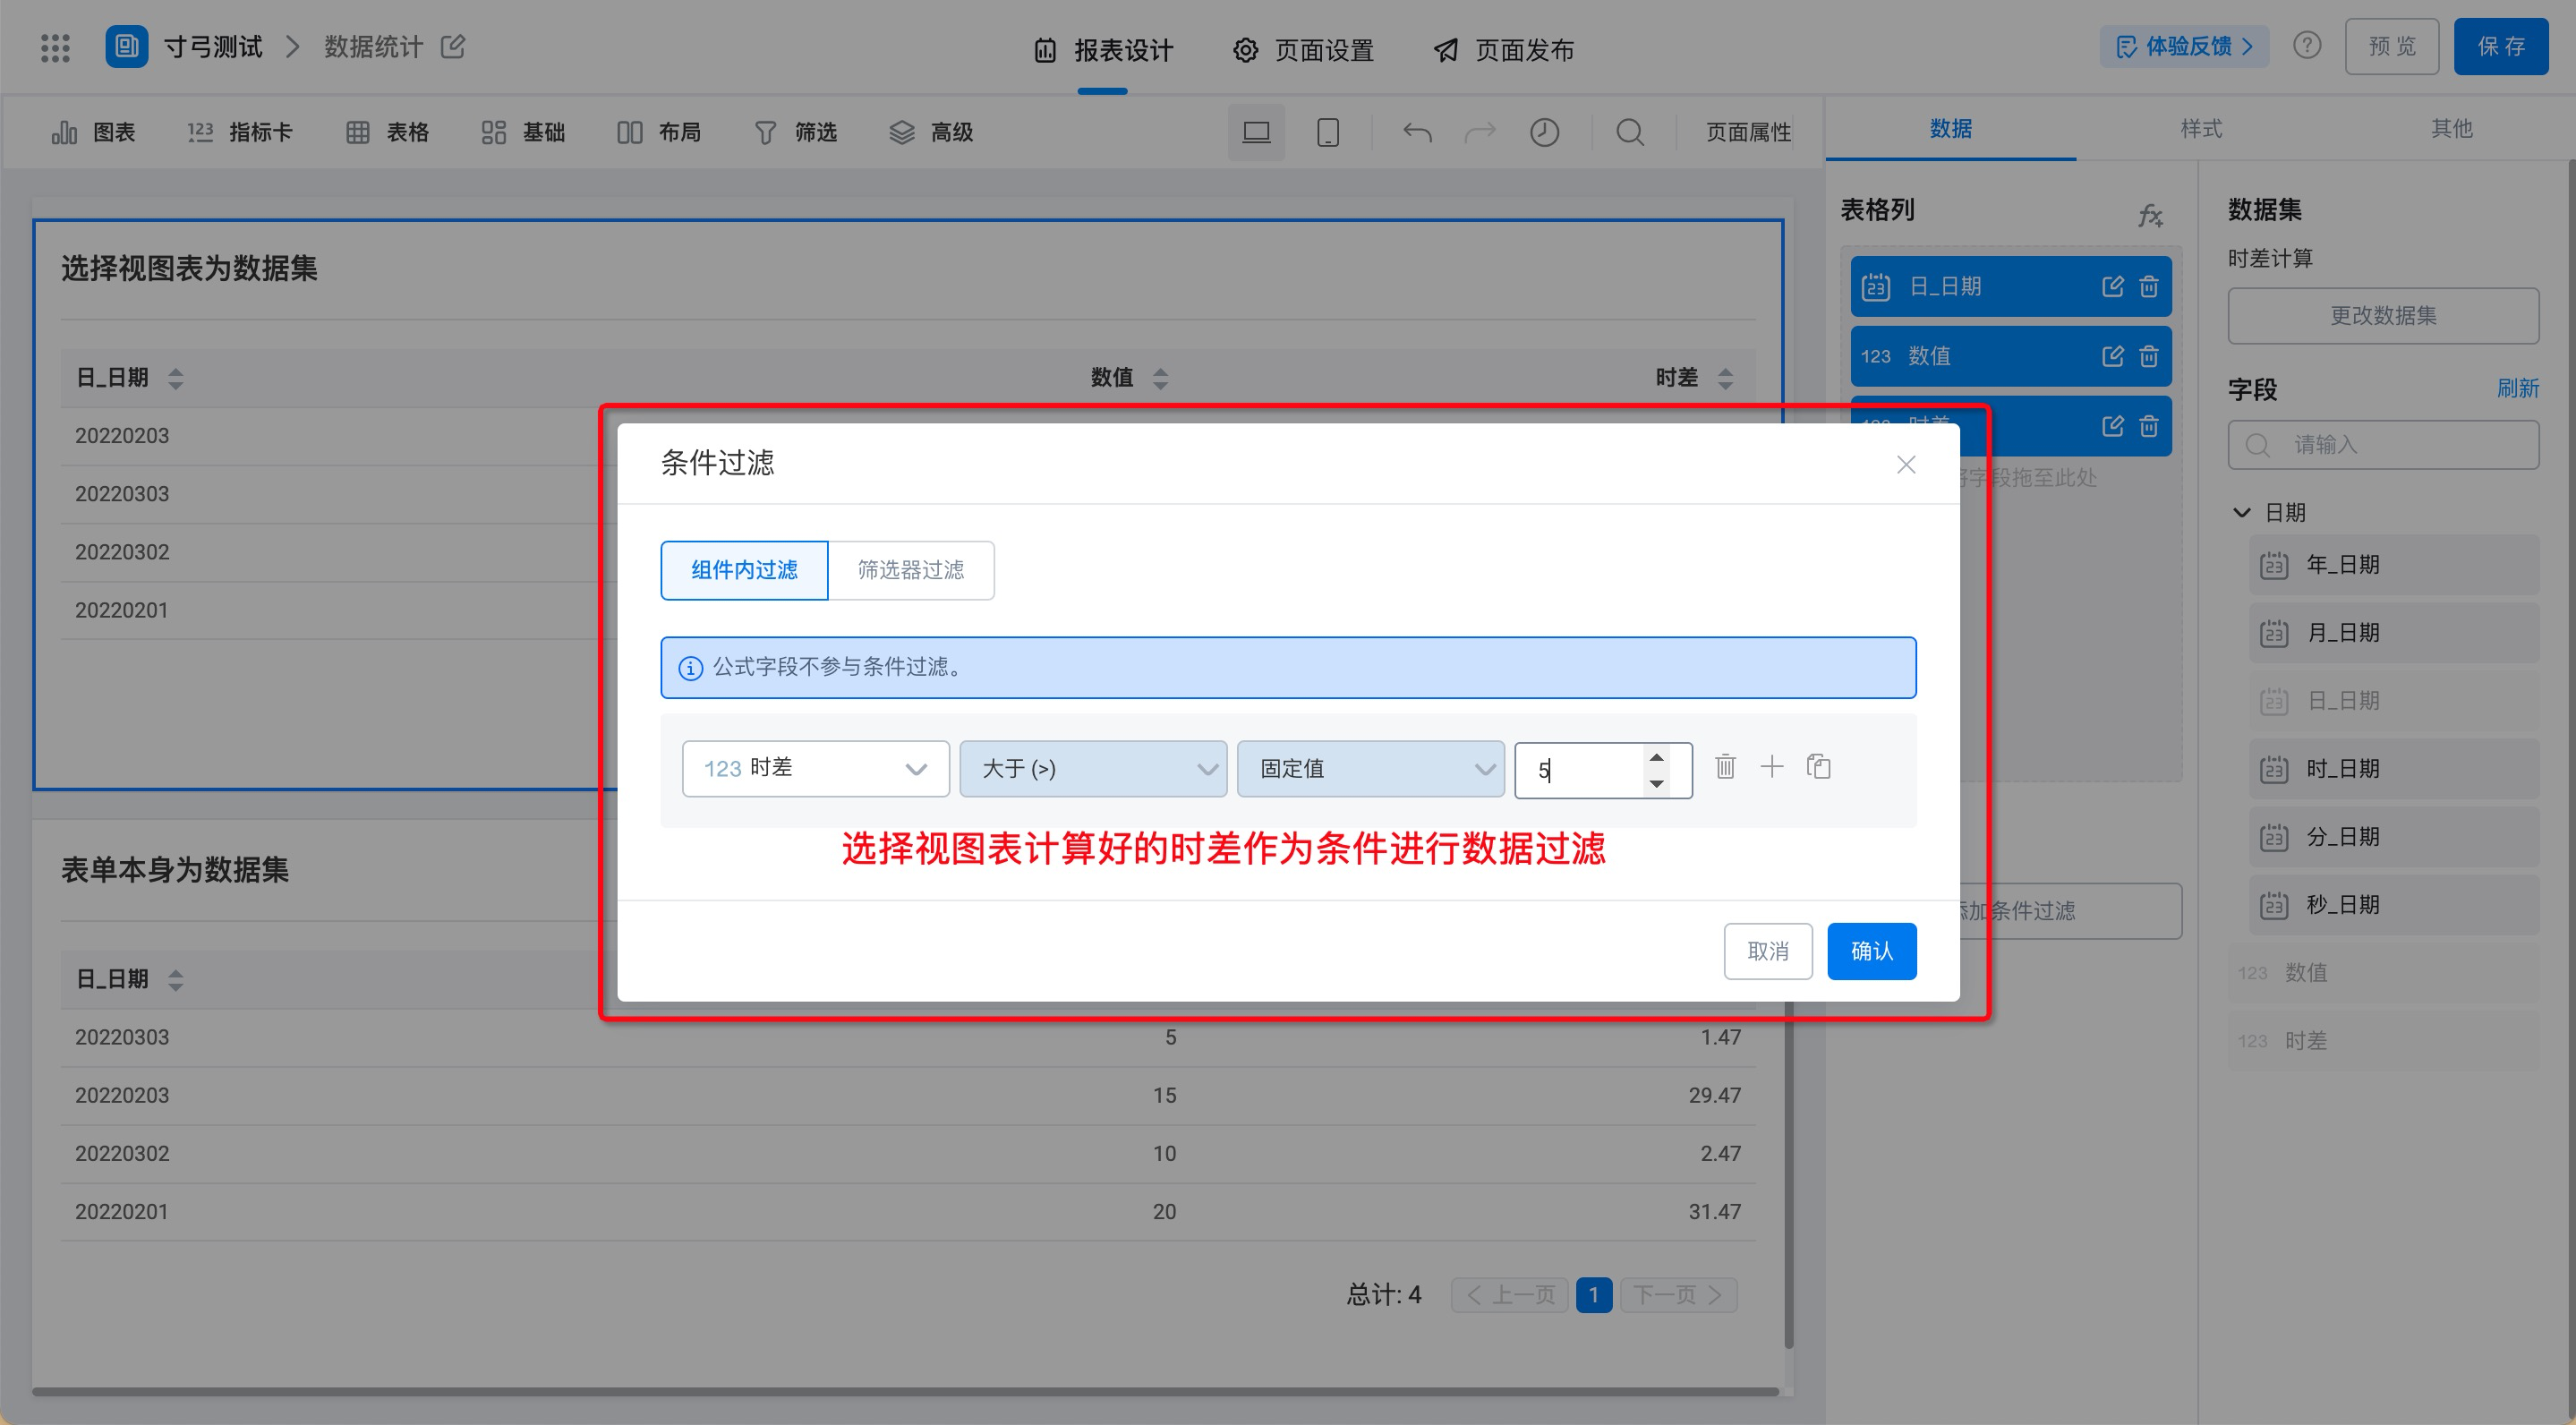
Select View chart as the table component dataset. You can select the calculation results when filtering conditions.
Procedure:
- Select dataset> configure table column fields (as shown in the following figure)
- Configure conditional filtering
4. FAQ
4.1 Why not calculate data inside the form?
Although the results of data calculation in the form participate in the conditional filtering of the table, they cannot be updated in real time. For example, today is March 4 and the form date component is March 2, the time difference can be calculated as 2 days, but when I open the form on March 5, the time difference will not be updated.