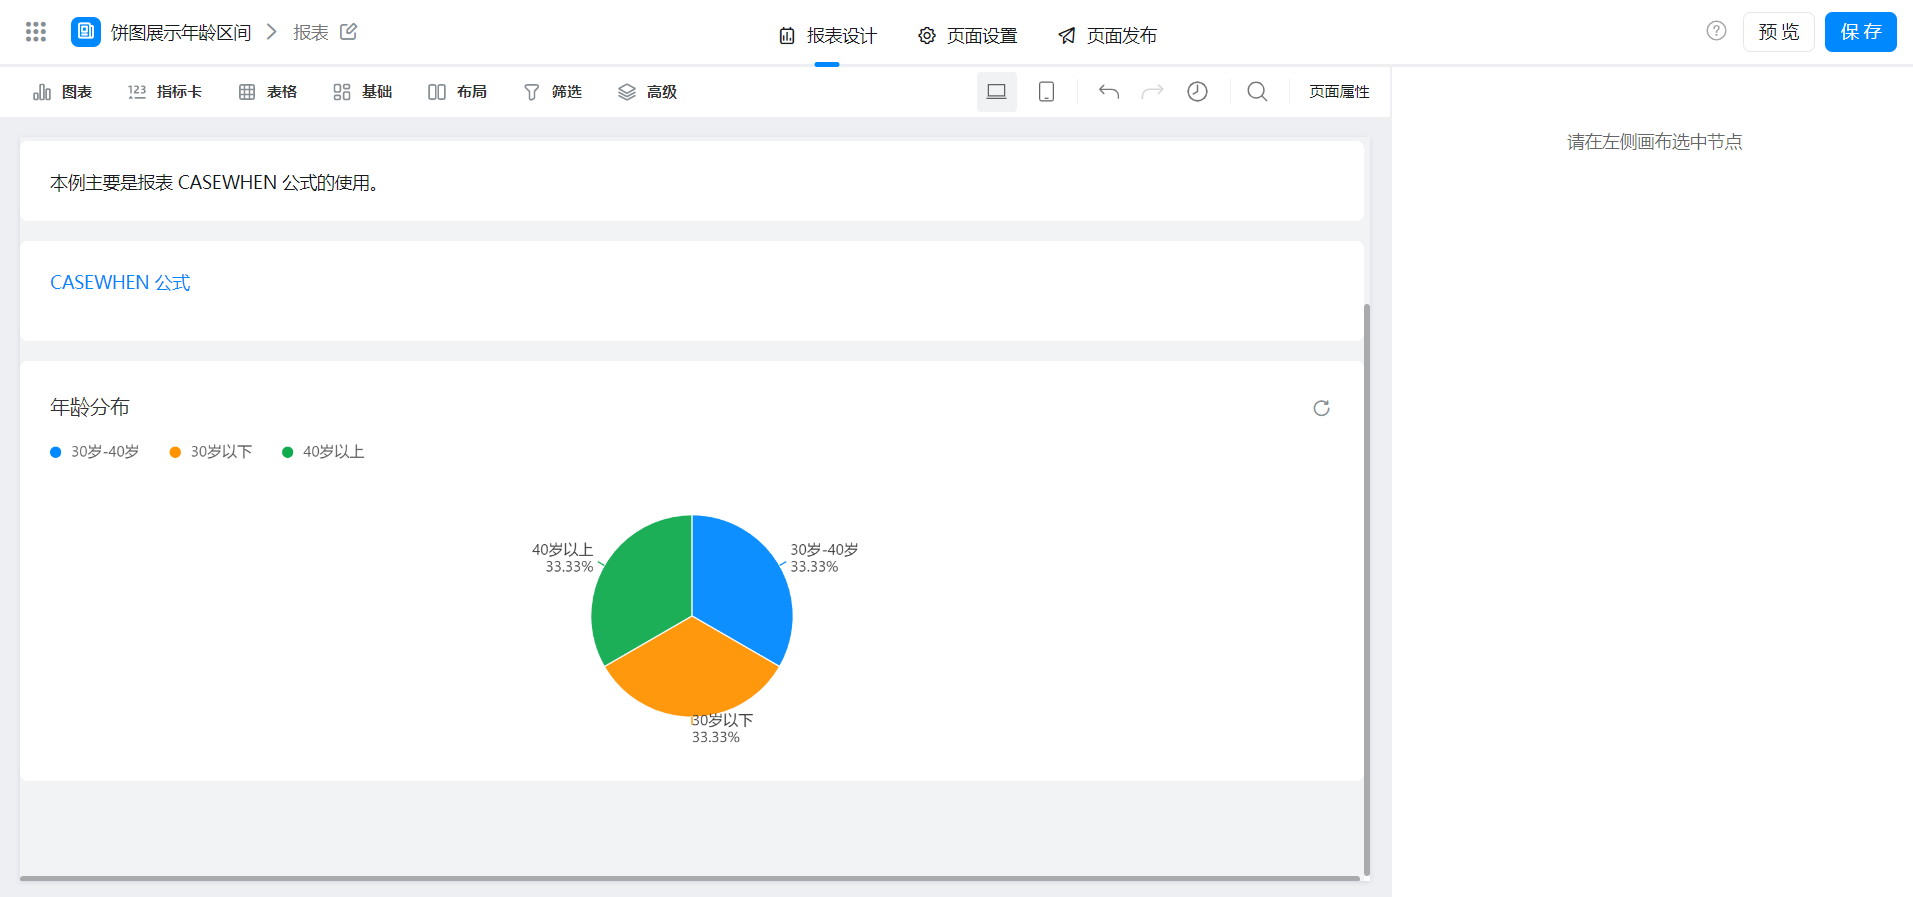
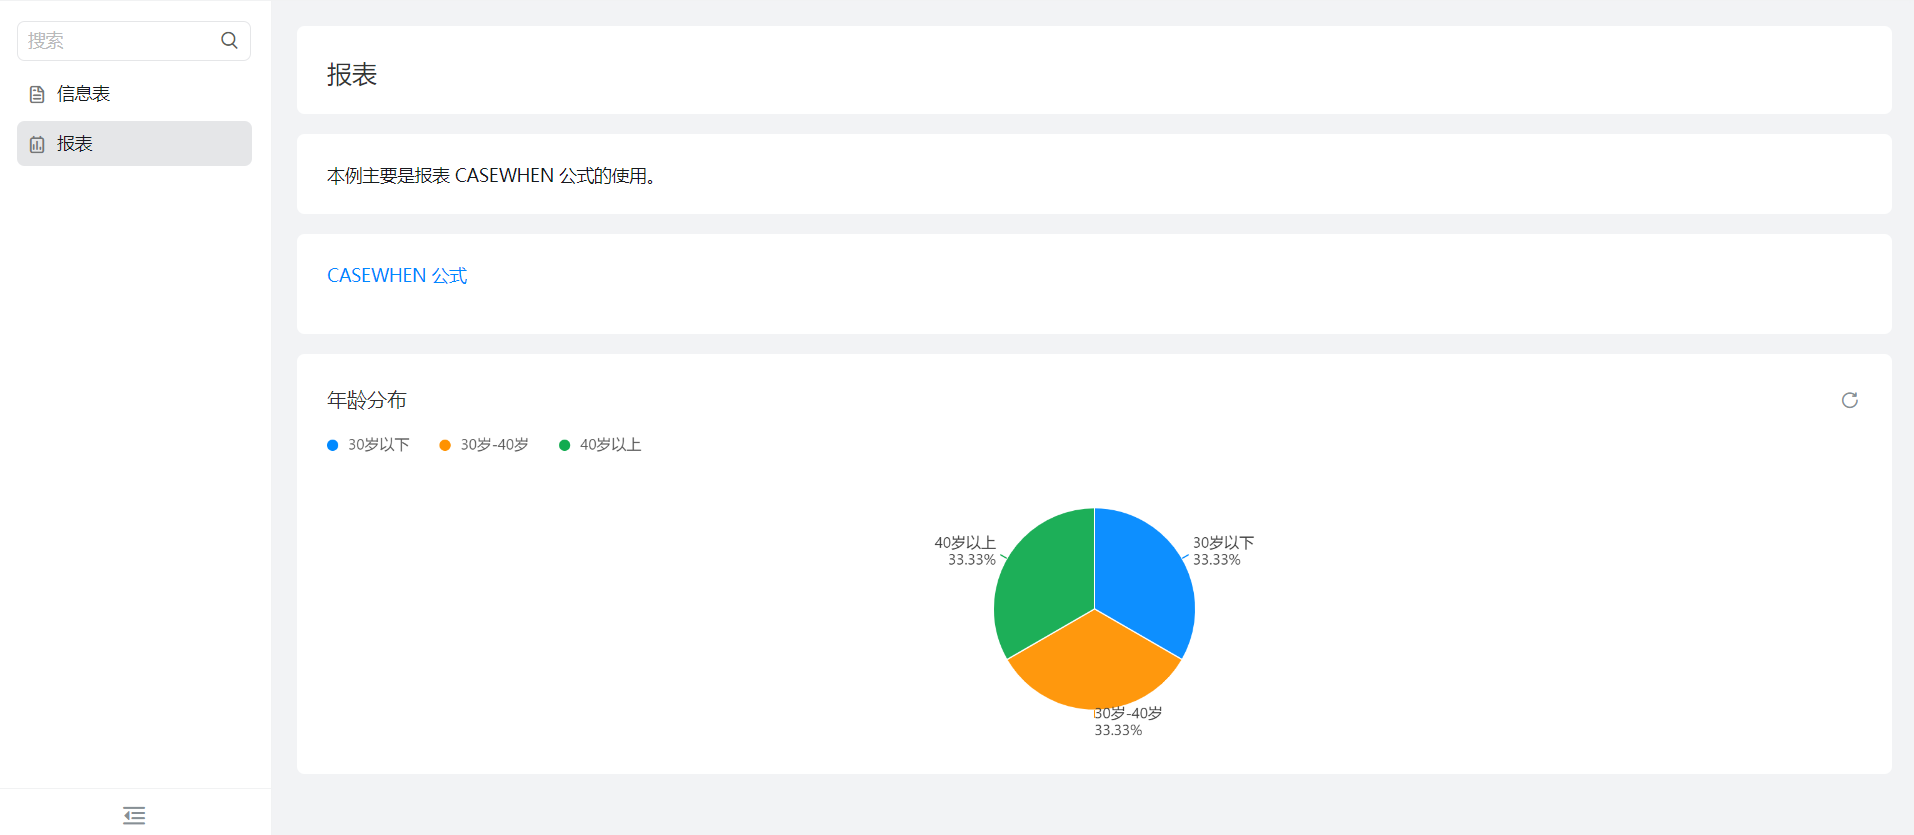
The pie chart in the report shows the age range.
1. Usage scenarios
When a shopping mall counts the age distribution of members, the age of members is displayed through pie chart. As shown in the figure, due to the large age and different users, therefore, we hope that the age categories in the table can be displayed. For example, there are data from 20 to 50 years old in the table. Now we need to classify and summarize the data according to the age, respectively:
- 20 to 30 years old is a category
- 30 to 40 years old is a category
- 40 to 50 years old is a category
2. Implement functions
2.1 Configuration report
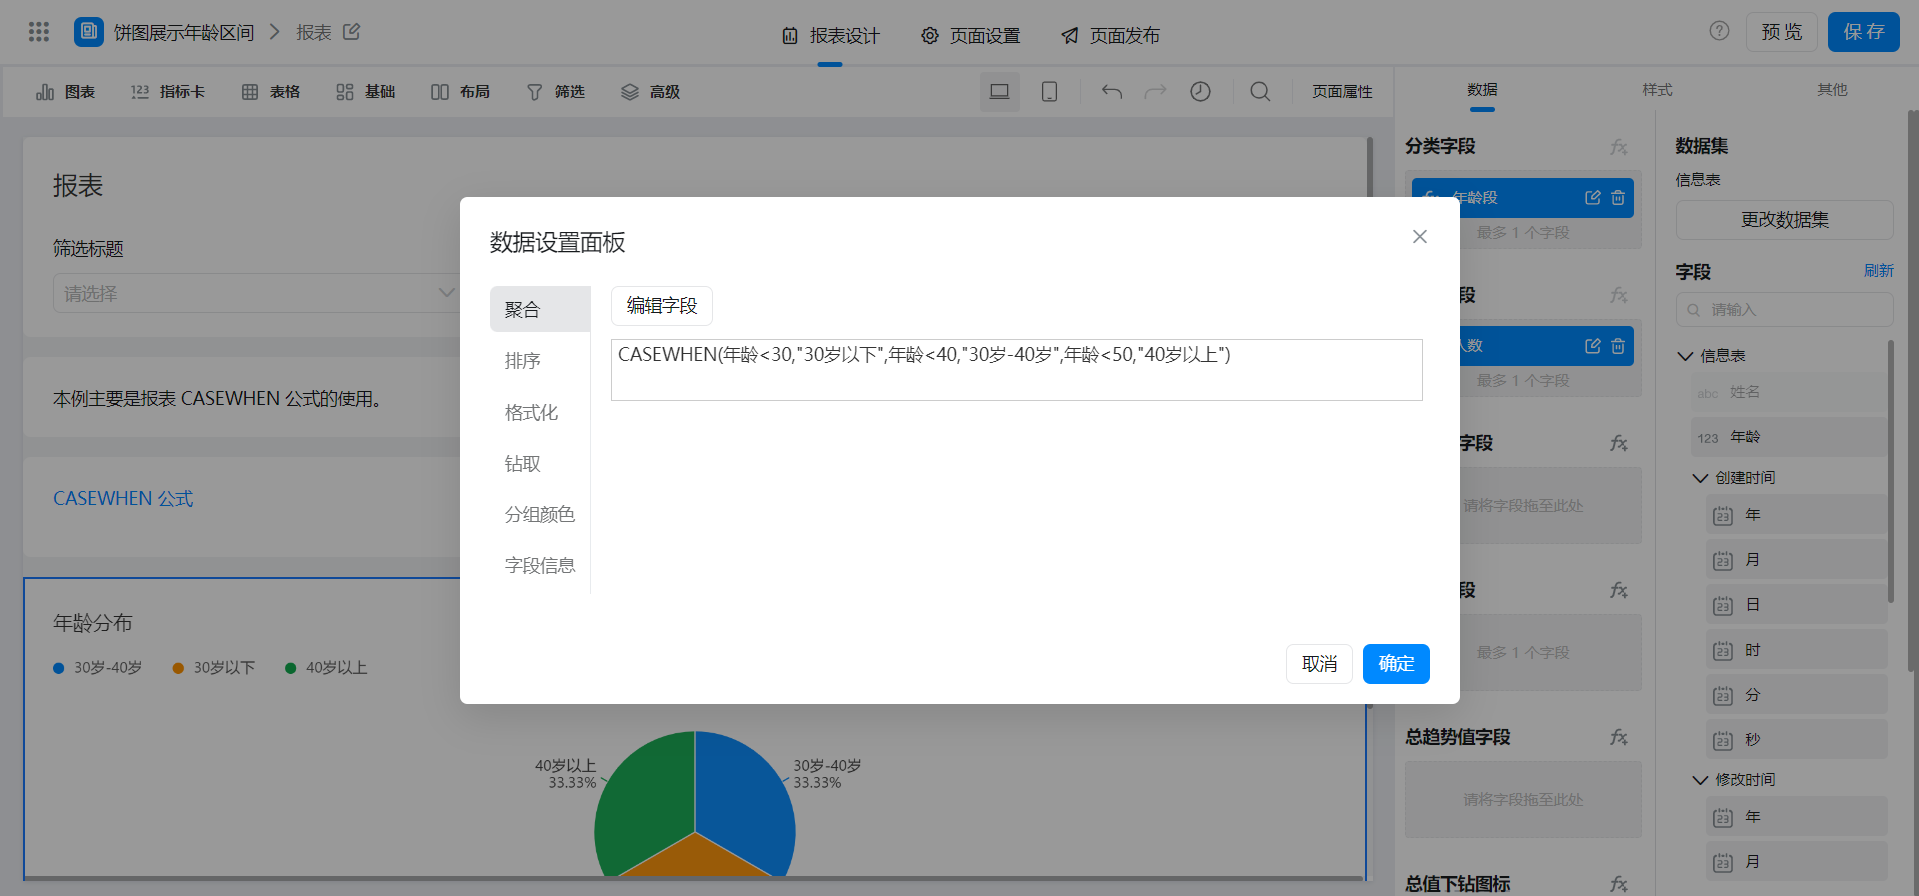
This example is mainly a reportCASEWHENThe use of the formula.


{"text":"CASEWHEN(年龄<30,\"30岁以下\",年龄<40,\"30岁-40岁\",年龄<50,\"40岁以上\")","marks":[{"from":{"line":0,"ch":9,"sticky":null},"to":{"line":0,"ch":13,"sticky":null},"value":"FORM_ZK866D91F4Q64X1BDMC0894XGD112D0OAL5CLT.numberField_lc5lbeho","invalid":false},{"from":{"line":0,"ch":25,"sticky":null},"to":{"line":0,"ch":29,"sticky":null},"value":"FORM_ZK866D91F4Q64X1BDMC0894XGD112D0OAL5CLT.numberField_lc5lbeho","invalid":false},{"from":{"line":0,"ch":43,"sticky":null},"to":{"line":0,"ch":47,"sticky":null},"value":"FORM_ZK866D91F4Q64X1BDMC0894XGD112D0OAL5CLT.numberField_lc5lbeho","invalid":false}],"isCmData":true}
3. Achieve results

4. Try it online
This doc is generated using machine translation. Any discrepancies or differences created in the translation are not binding and have no legal effect for compliance or enforcement purposes.
Is this document helpful?
